TOC
Introduction
The financial results of Bakkt Holdings, Inc is summarized in this page.
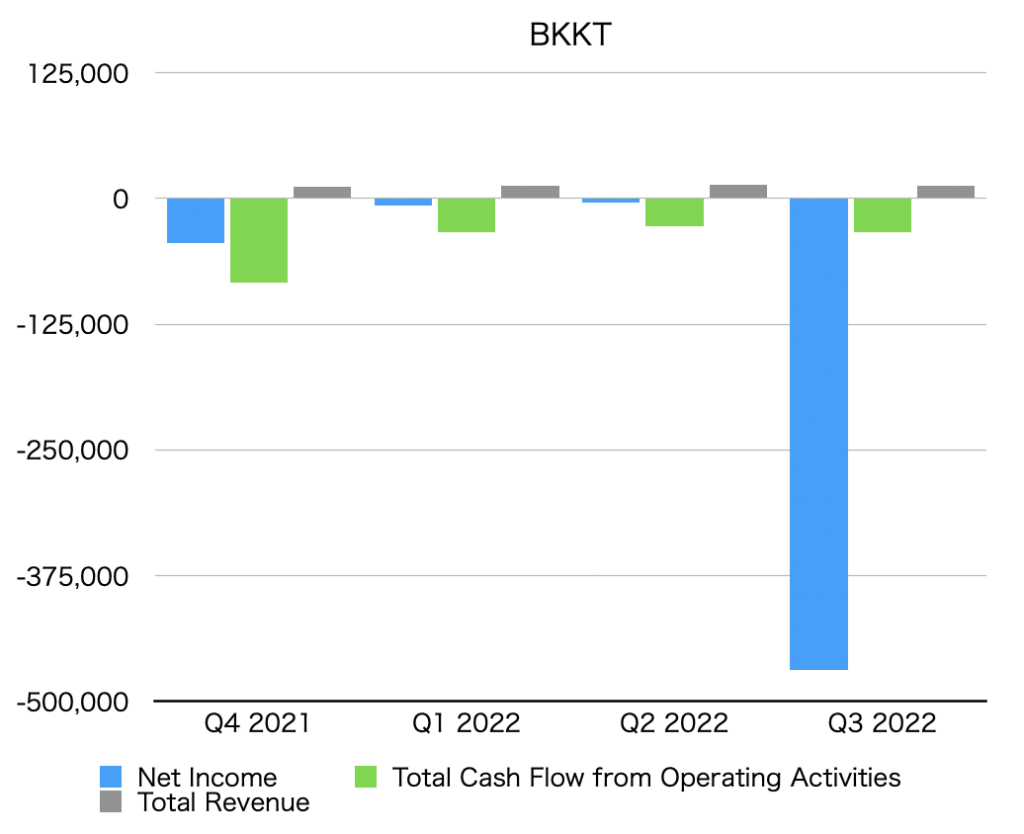
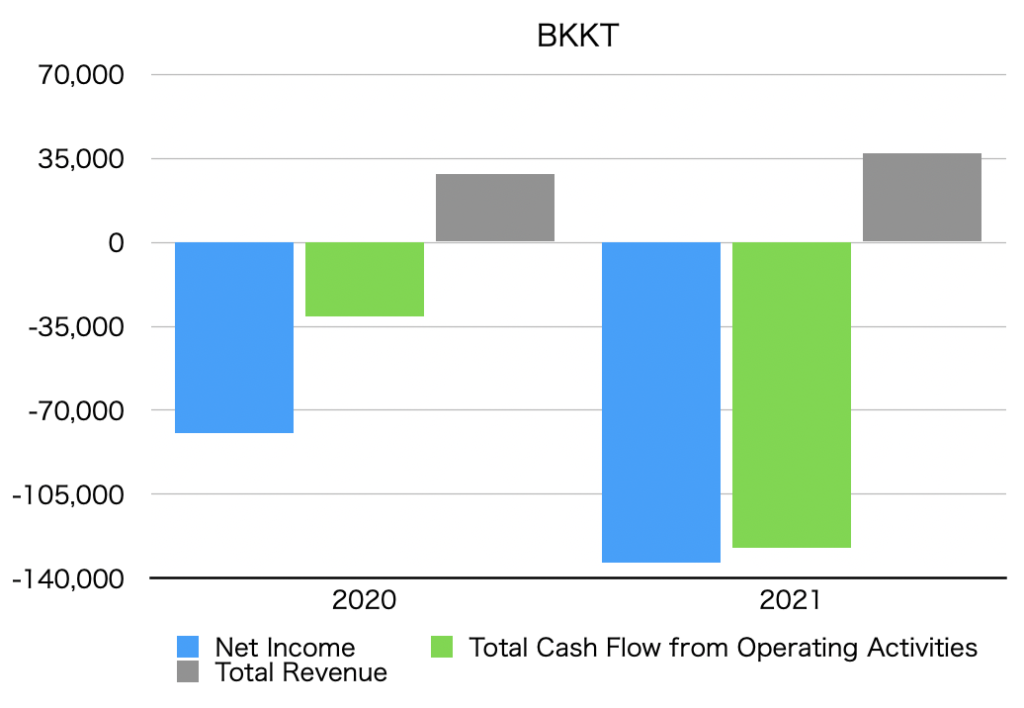
Summary of net income, operating cash flow, and total revenue (graph)
The unit is $1,000.
By quarter
 Ottaka
In Q3 2022, net income is significantly negative. On the other hand, operating cash flow is not so negative.
(noted on 2023.1.19)
By year
Net income
Net Income is below.
Quarterly data
| Net Income [$1,000] | |
| Q4 2021 | -43,995 |
| Q1 2022 | -7,128 |
| Q2 2022 | -3,897 |
| Q3 2022 | -468,132 |
Annual data
| Net Income [$1,000] | |
| 2020 | -79,605 |
| 2021 | -133,553 |
Operating cash flow
Total Cash Flow from Operating Activities is as follows.
Quarterly data
| Total Cash Flow from Operating Activities [$1,000] | |
| Q4 2021 | -83,387 |
| Q1 2022 | -33,156 |
| Q2 2022 | -27,274 |
| Q3 2022 | -33,475 |
Annual data
| Total Cash Flow from Operating Activities [$1,000] | |
| 2020 | -30,940 |
| 2021 | -127,164 |
Total revenue
Total revenue is below.
Quarterly data
| Total Revenue [$1,000] | |
| Q4 2021 | 11,481 |
| Q1 2021 | 12,532 |
| Q2 2022 | 13,572 |
| Q3 2022 | 12,860 |
Annual data
| Total Revenue [$1,000] | |
| 2020 | 28,495 |
| 2021 | 37,254 |
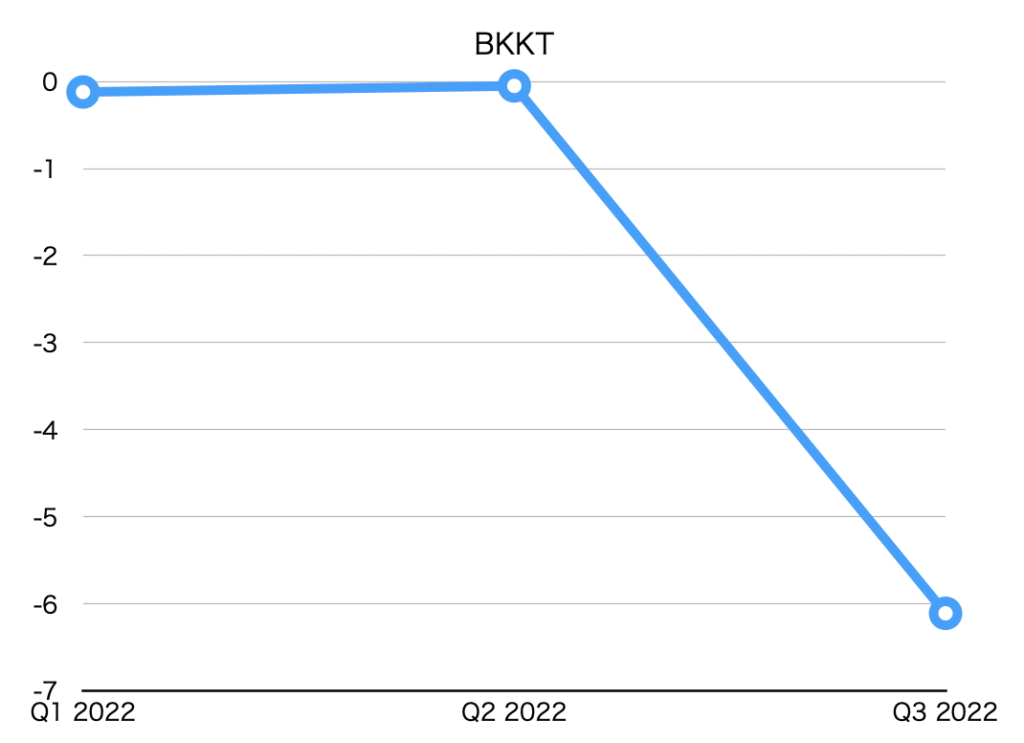
EPS (Net earnings per share)
| EPS [$] | |
| Q1 2022 | -0.12 |
| Q2 2022 | -0.05 |
| Q3 2022 | -6.11 |
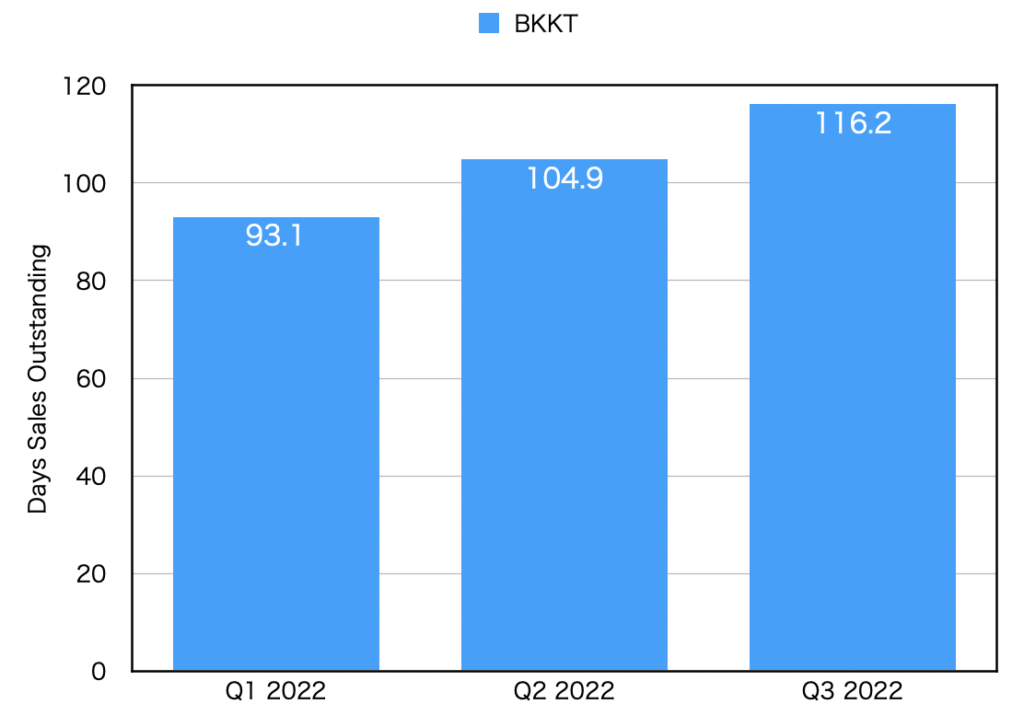
DSO(Days sales outstanding)
| DSO [day] | |
| Q1 2022 | 93.1 |
| Q2 2022 | 104.9 |
| Q3 2022 | 116.2 |