Introduction
The financial results of Globalstar, Inc. are summarized on this page.
Company profile
Globalstar is a satellite communications company that provides mobile voice and data communication services using its network of Low Earth Orbit (LEO) satellites. The company’s services include voice and data communication, satellite phone and hotspot devices, asset tracking and monitoring, and emergency response services. Globalstar’s network covers most of the world’s populated areas, including remote and rural regions where traditional communication infrastructure is limited or nonexistent.
Globalstar’s services are used by various customers, including businesses, governments, and individuals, in maritime, aviation, oil and gas, forestry, and emergency response industries. In addition, the company’s satellite technology enables reliable communication in areas where traditional land-based or cellular communication networks are not available, making it an essential tool for those who work and travel in remote or isolated sites.
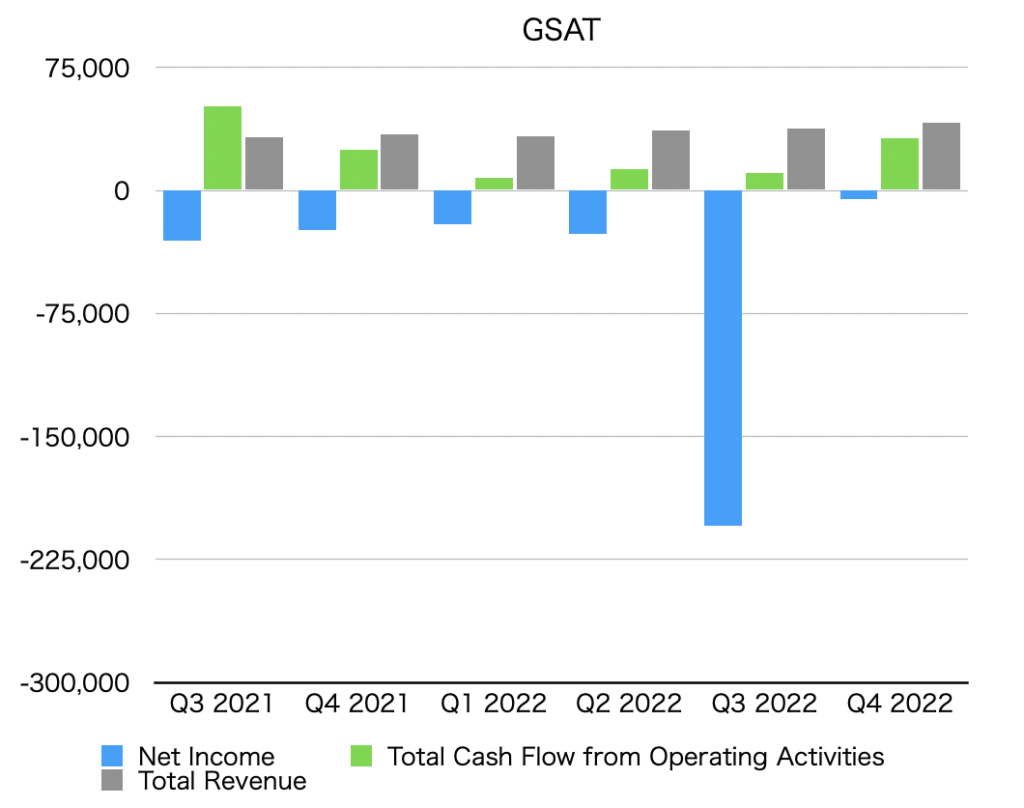
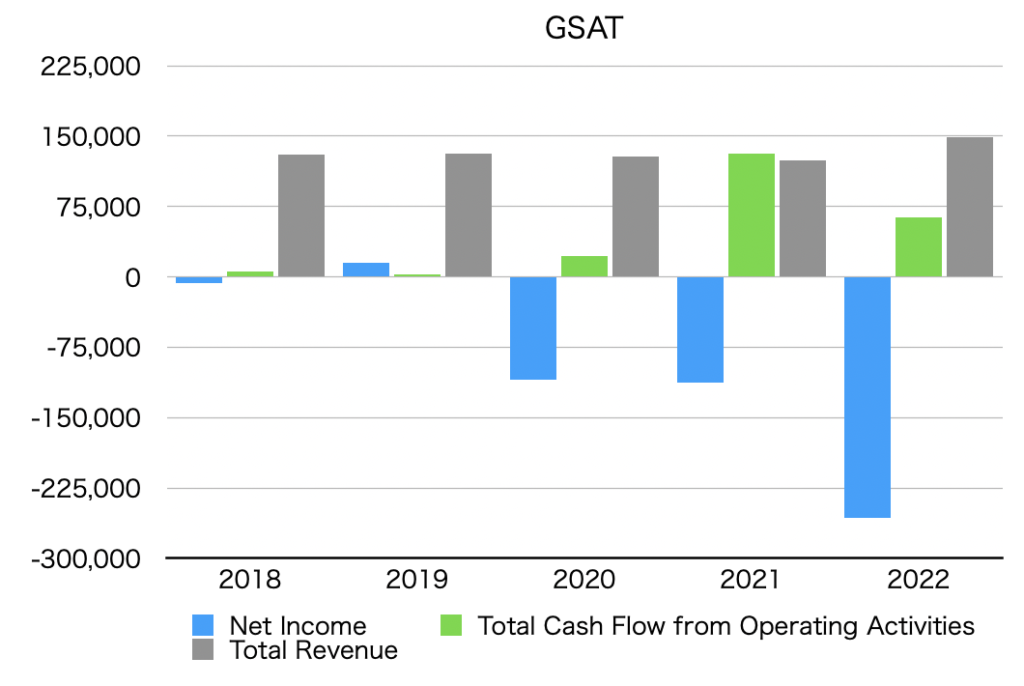
Summary of net income, operating cash flow, and total revenue (graph)
The unit is $1,000.
By quarter
By year
Net income
Net Income is below.
Quarterly data
| Net Income [$1,000] | |
| Q3 2021 | -30,885 |
| Q4 2021 | -23,958 |
| Q1 2022 | -20,462 |
| Q2 2022 | -26,757 |
| Q3 2022 | -204,361 |
| Q4 2022 | -5,335 |
Annual data
| Net Income [$1,000] | |
| 2018 | -6,516 |
| 2019 | 15,324 |
| 2020 | -109,639 |
| 2021 | -112,625 |
| 2022 | -256,915 |
Operating cash flow
Total Cash Flow from Operating Activities is as follows.
Quarterly data
| Total Cash Flow from Operating Activities [$1,000] | |
| Q3 2021 | 51,246 |
| Q4 2021 | 24,715 |
| Q1 2022 | 7,569 |
| Q2 2022 | 13,202 |
| Q3 2022 | 10,934 |
| Q4 2022 | 32,100 |
Annual data
| Total Cash Flow from Operating Activities [$1,000] | |
| 2018 | 5,920 |
| 2019 | 3,048 |
| 2020 | 22,215 |
| 2021 | 131,881 |
| 2022 | 63,800 |
Total revenue
Total revenue is below.
Quarterly data
| Total Revenue [$1,000] | |
| Q3 2021 | 32,614 |
| Q4 2021 | 34,475 |
| Q1 2022 | 32,772 |
| Q2 2022 | 36,800 |
| Q3 2022 | 37,626 |
| Q4 2022 | 41,306 |
Annual data
| Total Revenue [$1,000] | |
| 2018 | 130,113 |
| 2019 | 131,718 |
| 2020 | 128,487 |
| 2021 | 124,297 |
| 2022 | 148,504 |
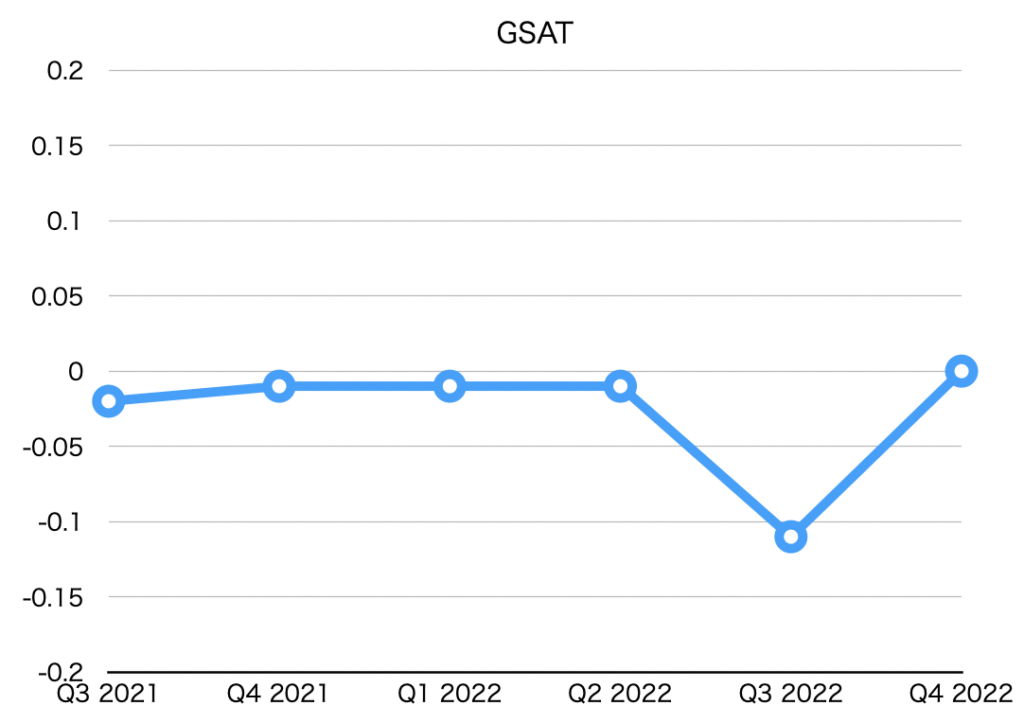
EPS (Net earnings per share)
| EPS [$] | |
| Q3 2021 | -0.02 |
| Q4 2021 | -0.01 |
| Q1 2022 | -0.01 |
| Q2 2022 | -0.01 |
| Q3 2022 | -0.11 |
| Q4 2022 | 0.00 |
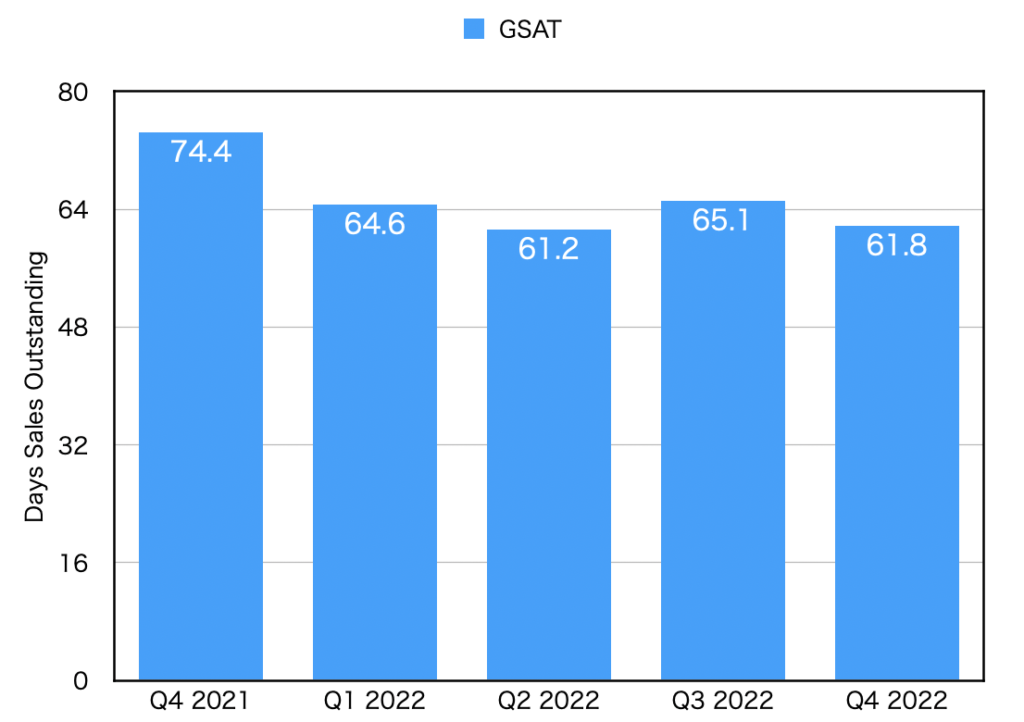
DSO(Days sales outstanding)
| DSO [day] | |
| Q4 2021 | 74.4 |
| Q1 2022 | 64.6 |
| Q2 2022 | 61.2 |
| Q3 2022 | 65.1 |
| Q4 2022 | 61.8 |