TOC
Introduction
The financial results of Blade Air Mobility, Inc is summarized in this page.
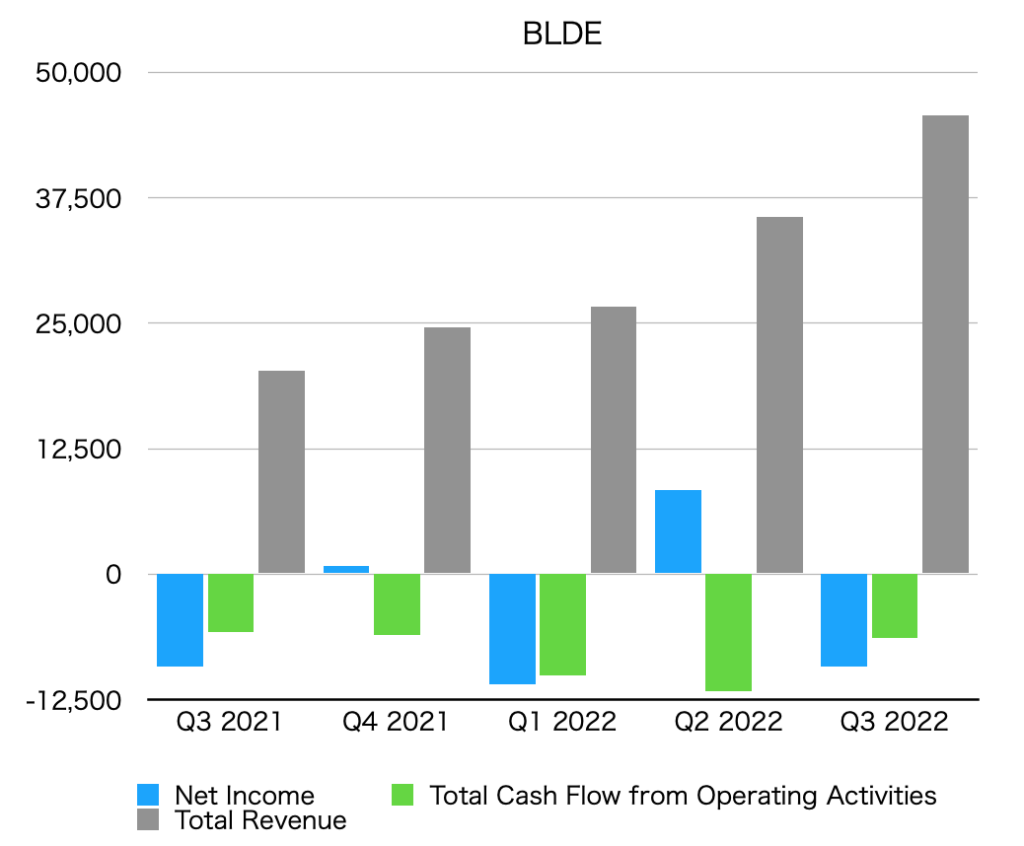
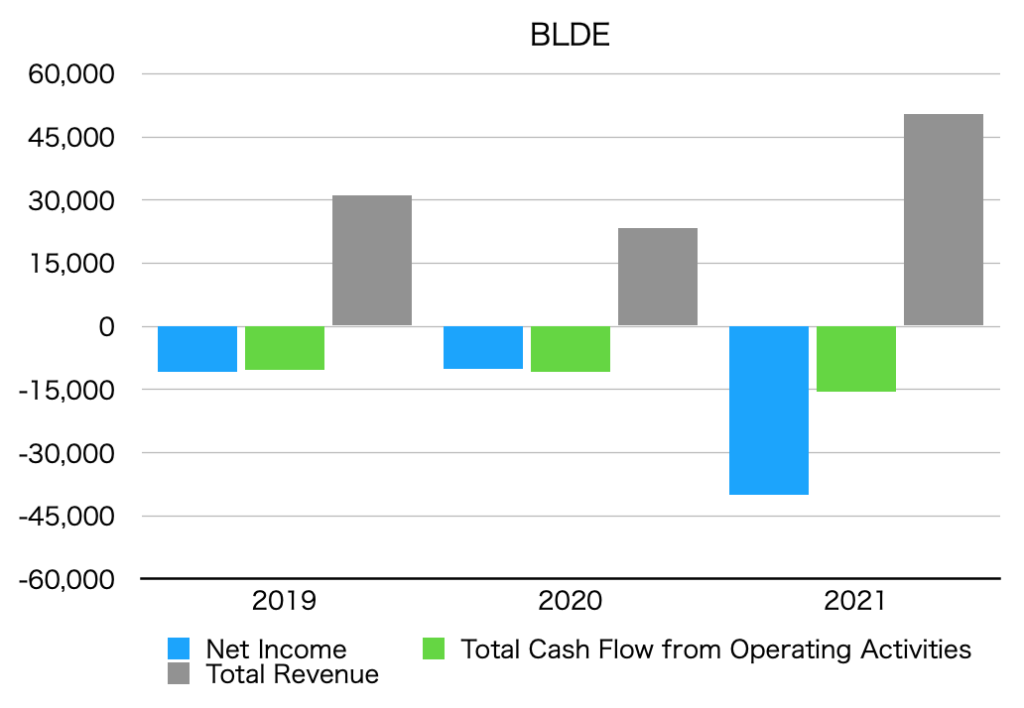
Summary of net income, operating cash flow, and total revenue (graph)
The unit is $1,000.
By quarter
By year
Net income
Net Income is below.
Quarterly data
| Net Income [$1,000] | |
| Q3 2021 | -9,184 |
| Q4 2021 | 772 |
| Q1 2022 | -11,012 |
| Q2 2022 | 8,412 |
| Q3 2022 | -9,245 |
Annual data
| Net Income [$1,000] | |
| 2019 | -10,838 |
| 2020 | -10,160 |
| 2021 | -40,052 |
Operating cash flow
Total Cash Flow from Operating Activities is as follows.
Quarterly data
| Total Cash Flow from Operating Activities [$1,000] | |
| Q3 2021 | -5,790 |
| Q4 2021 | -6,016 |
| Q1 2022 | -10,065 |
| Q2 2022 | -11,610 |
| Q3 2022 | -6,351 |
Annual data
| Total Cash Flow from Operating Activities [$1,000] | |
| 2019 | -10,302 |
| 2020 | -10,818 |
| 2021 | -15,615 |
Total revenue
Total revenue is below.
Quarterly data
| Total Revenue [$1,000] | |
| Q3 2021 | 20,316 |
| Q4 2021 | 24,618 |
| Q1 2021 | 26,630 |
| Q2 2022 | 35,633 |
| Q3 2022 | 45,722 |
Annual data
| Total Revenue [$1,000] | |
| 2019 | 31,196 |
| 2020 | 23,434 |
| 2021 | 50,526 |
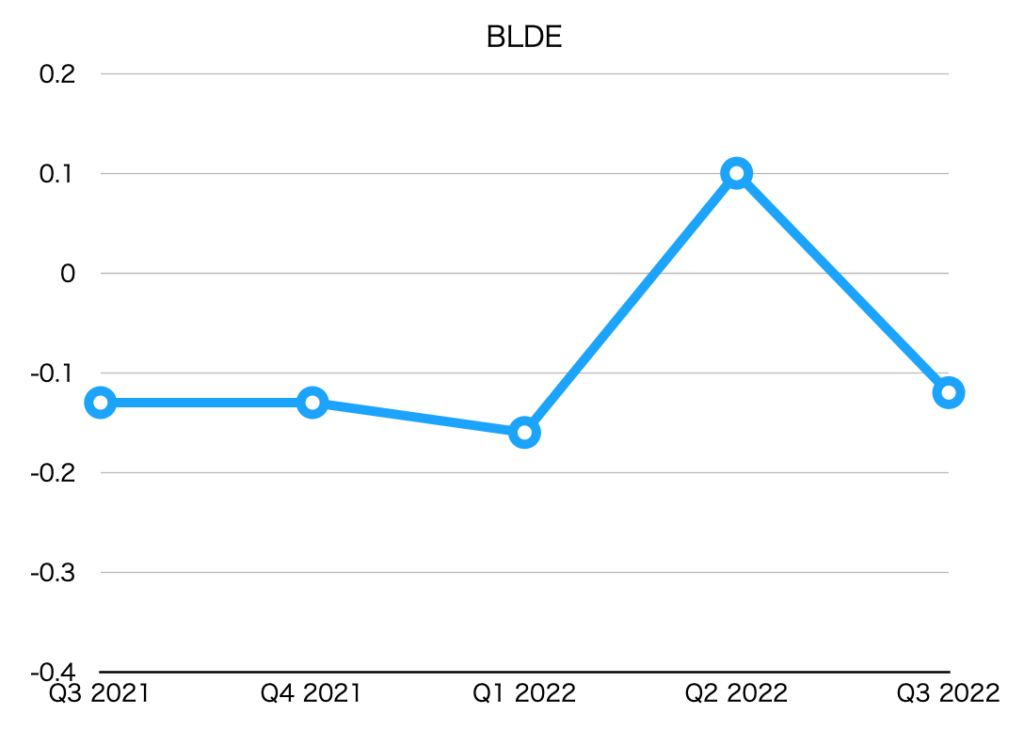
EPS (Net earnings per share)
| EPS [$] | |
| Q3 2021 | -0.13 |
| Q4 2021 | -0.13 |
| Q1 2022 | -0.16 |
| Q2 2022 | 0.10 |
| Q3 2022 | -0.12 |
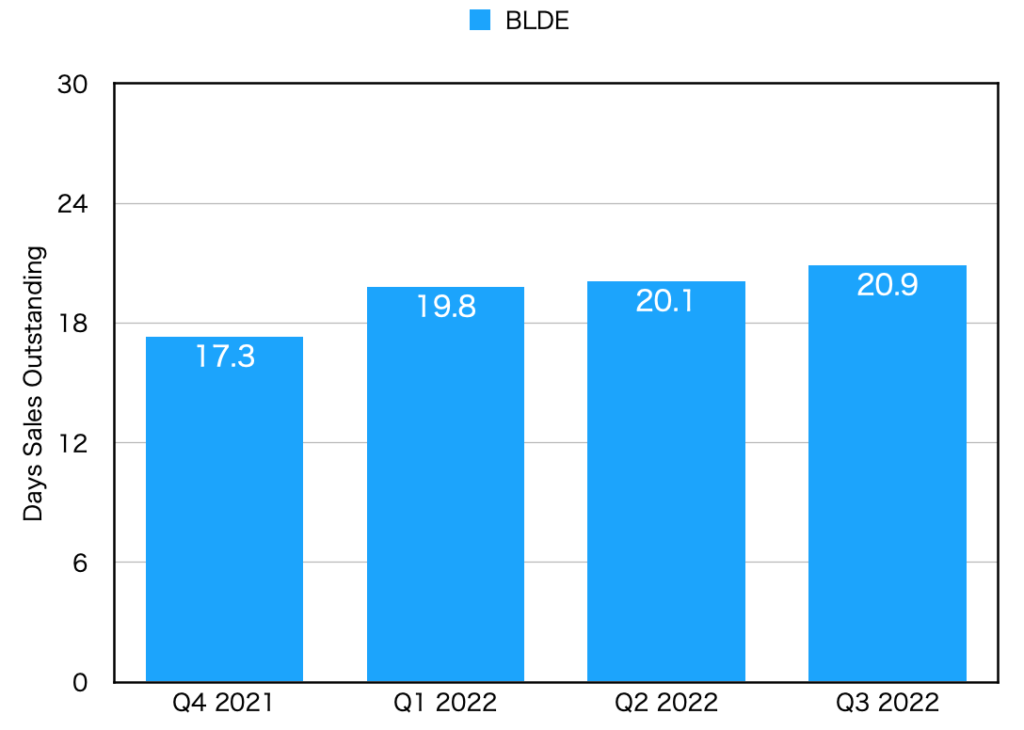
DSO(Days sales outstanding)
| DSO [day] | |
| Q4 2021 | 17.3 |
| Q1 2022 | 19.8 |
| Q2 2022 | 20.1 |
| Q3 2022 | 20.9 |