TOC
Introduction
The financial results of Iridium Communications Inc is summarized in this page.
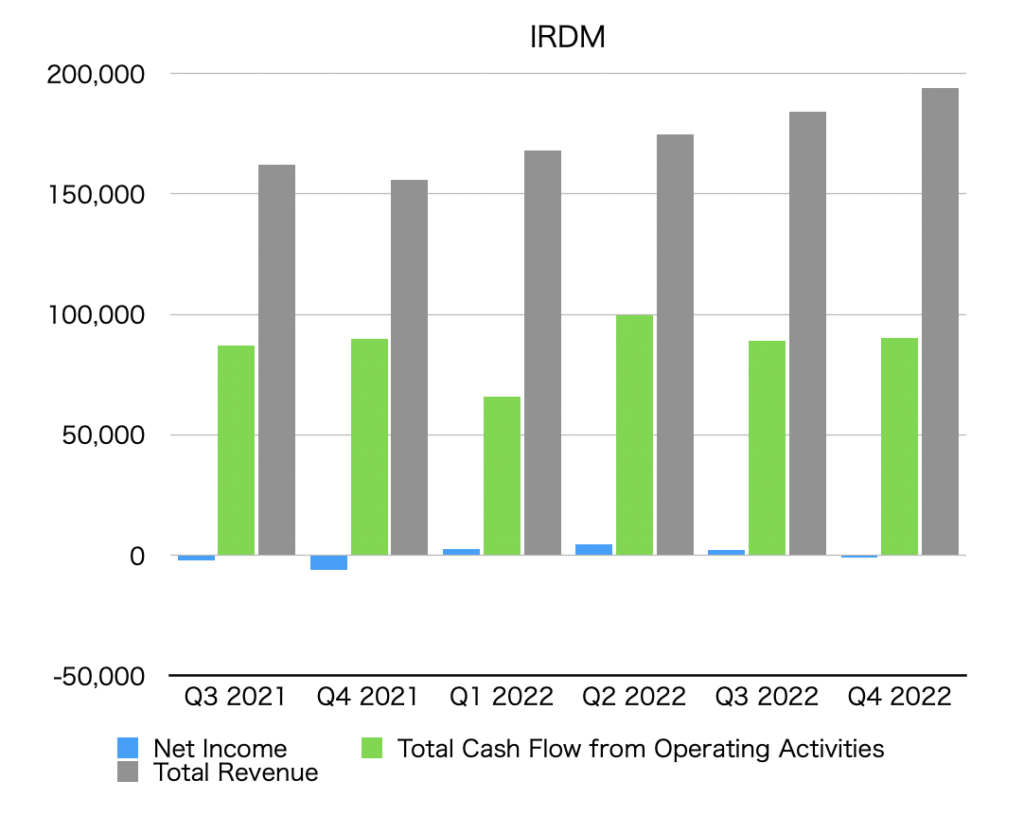
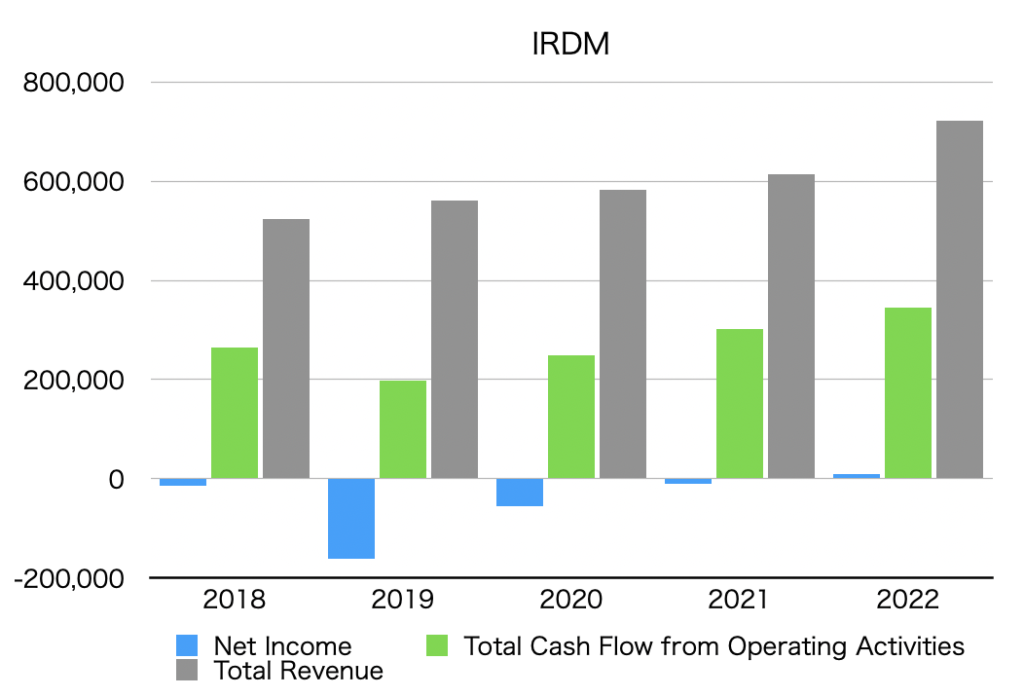
Summary of net income, operating cash flow, and total revenue (graph)
The unit is $1,000.
By quarter
By year
Net income
Net Income is below.
Quarterly data
| Net Income [$1,000] | |
| Q3 2021 | -2,085 |
| Q4 2021 | -5,884 |
| Q1 2022 | 2,824 |
| Q2 2022 | 4,557 |
| Q3 2022 | 2,149 |
| Q4 2022 | -808 |
Annual data
| Net Income [$1,000] | |
| 2018 | -13,384 |
| 2019 | -161,999 |
| 2020 | -56,054 |
| 2021 | -9,319 |
| 2022 | 8,722 |
Operating cash flow
Total Cash Flow from Operating Activities is as follows.
Quarterly data
| Total Cash Flow from Operating Activities [$1,000] | |
| Q3 2021 | 87,170 |
| Q4 2021 | 89,737 |
| Q1 2022 | 65,770 |
| Q2 2022 | 99,795 |
| Q3 2022 | 88,893 |
| Q4 2022 | 90,271 |
Annual data
| Total Cash Flow from Operating Activities [$1,000] | |
| 2018 | 263,709 |
| 2019 | 198,143 |
| 2020 | 249,767 |
| 2021 | 302,874 |
| 2022 | 344,729 |
Total revenue
Total revenue is below.
Quarterly data
| Total Revenue [$1,000] | |
| Q3 2021 | 162,159 |
| Q4 2021 | 155,887 |
| Q1 2021 | 168,219 |
| Q2 2022 | 174,919 |
| Q3 2022 | 184,060 |
| Q4 2022 | 193,836 |
Annual data
| Total Revenue [$1,000] | |
| 2018 | 523,008 |
| 2019 | 560,444 |
| 2020 | 583,439 |
| 2021 | 614,500 |
| 2022 | 721,034 |
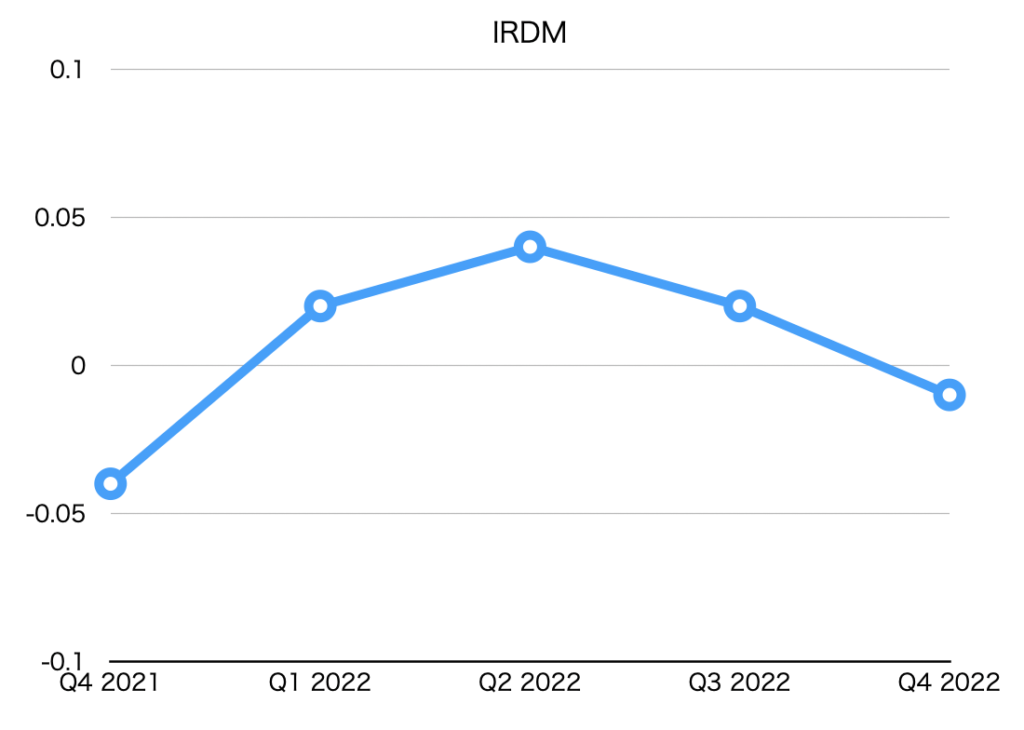
EPS (Net earnings per share)
| EPS [$] | |
| Q4 2021 | -0.04 |
| Q1 2022 | 0.02 |
| Q2 2022 | 0.04 |
| Q3 2022 | 0.02 |
| Q4 2022 | -0.01 |
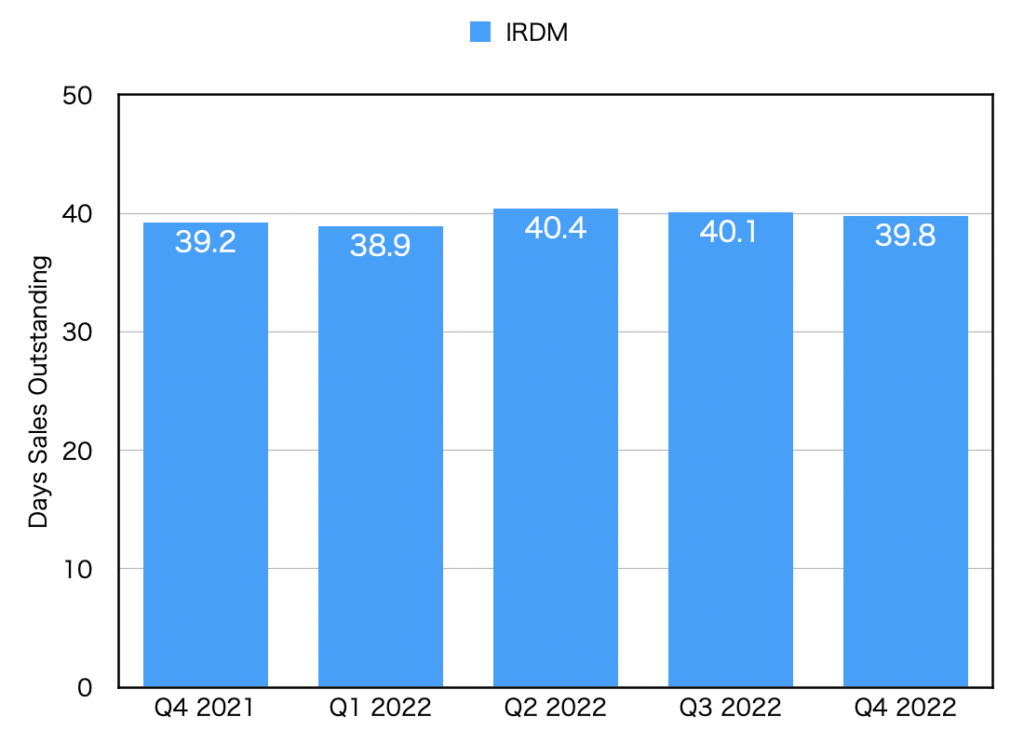
DSO(Days sales outstanding)
| DSO [day] | |
| Q4 2021 | 39.2 |
| Q1 2022 | 38.9 |
| Q2 2022 | 40.4 |
| Q3 2022 | 40.1 |
| Q4 2022 | 39.8 |