TOC
Introduction
The financial results of Rush Street Interactive, Inc is summarized in this page.
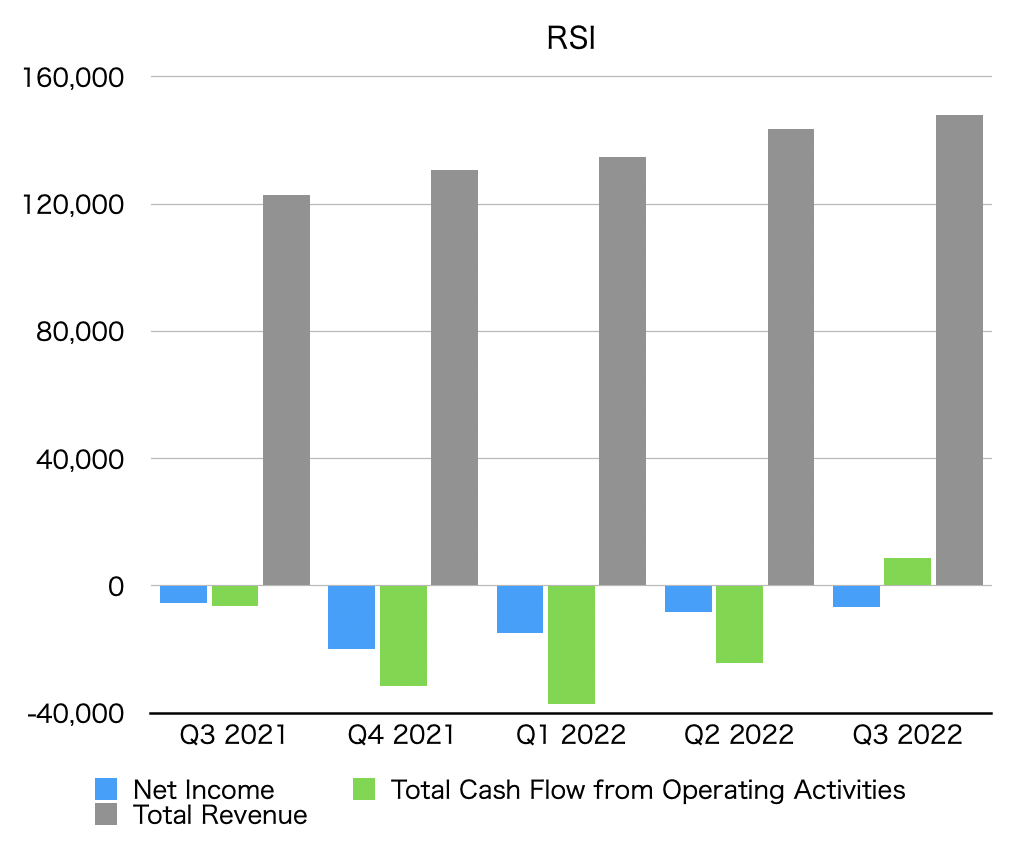
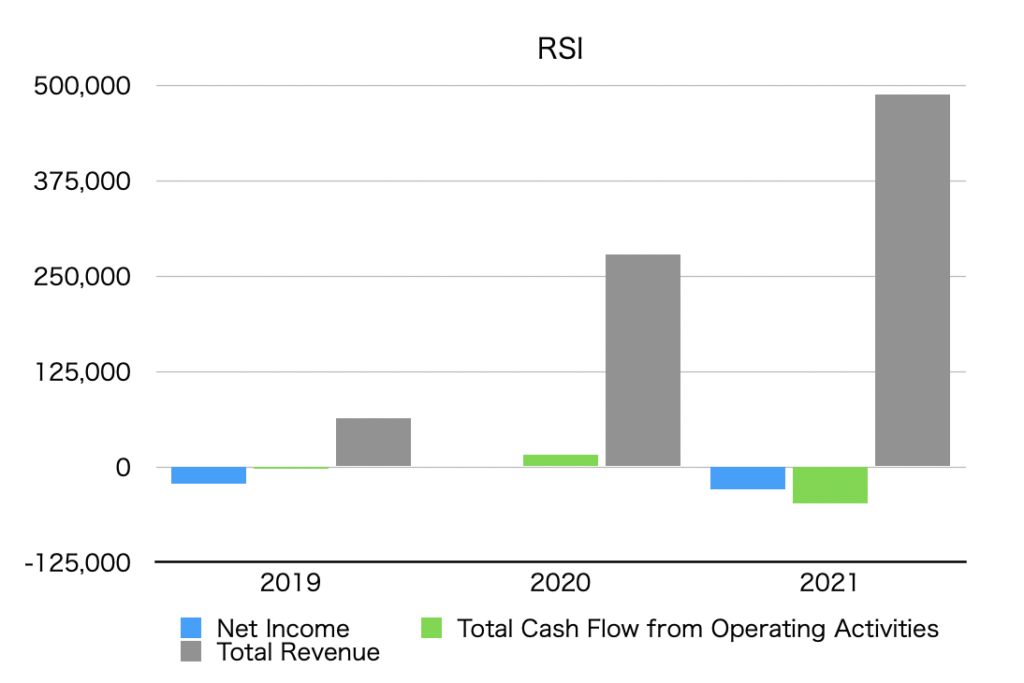
Summary of net income, operating cash flow, and total revenue (graph)
The unit is $1,000.
By quarter
By year
Net income
Net Income is below.
Quarterly data
| Net Income [$1,000] | |
| Q3 2021 | -5,300 |
| Q4 2021 | -19,974 |
| Q1 2022 | -14,697 |
| Q2 2022 | -8,332 |
| Q3 2022 | -6,613 |
Annual data
| Net Income [$1,000] | |
| 2019 | -22,450 |
| 2020 | -575 |
| 2021 | -29,058 |
Operating cash flow
Total Cash Flow from Operating Activities is as follows.
Quarterly data
| Total Cash Flow from Operating Activities [$1,000] | |
| Q3 2021 | -6,254 |
| Q4 2021 | -31,509 |
| Q1 2022 | -37,007 |
| Q2 2022 | -24,257 |
| Q3 2022 | 8,641 |
Annual data
| Total Cash Flow from Operating Activities [$1,000] | |
| 2019 | -2,459 |
| 2020 | 16,179 |
| 2021 | -48,186 |
Total revenue
Total revenue is below.
Quarterly data
| Total Revenue [$1,000] | |
| Q3 2021 | 122,920 |
| Q4 2021 | 130,565 |
| Q1 2021 | 134,938 |
| Q2 2022 | 143,736 |
| Q3 2022 | 148,004 |
Annual data
| Total Revenue [$1,000] | |
| 2019 | 63,667 |
| 2020 | 278,500 |
| 2021 | 488,105 |
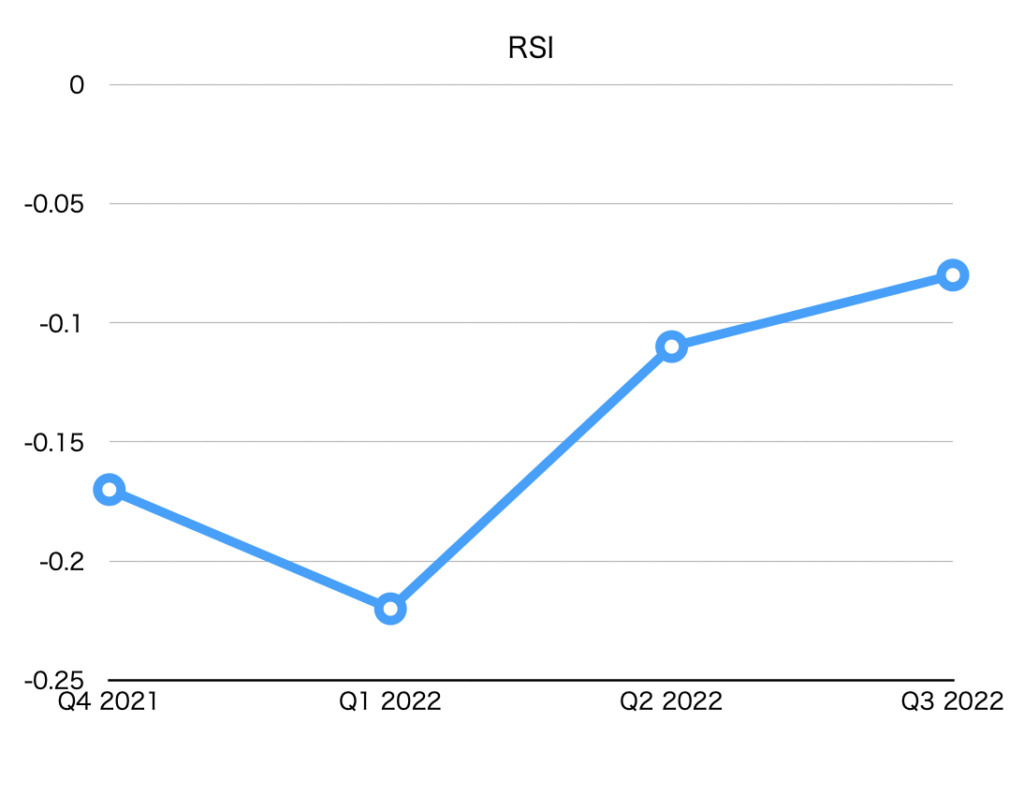
EPS (Net earnings per share)
| EPS [$] | |
| Q4 2021 | -0.17 |
| Q1 2022 | -0.22 |
| Q2 2022 | -0.11 |
| Q3 2022 | -0.08 |
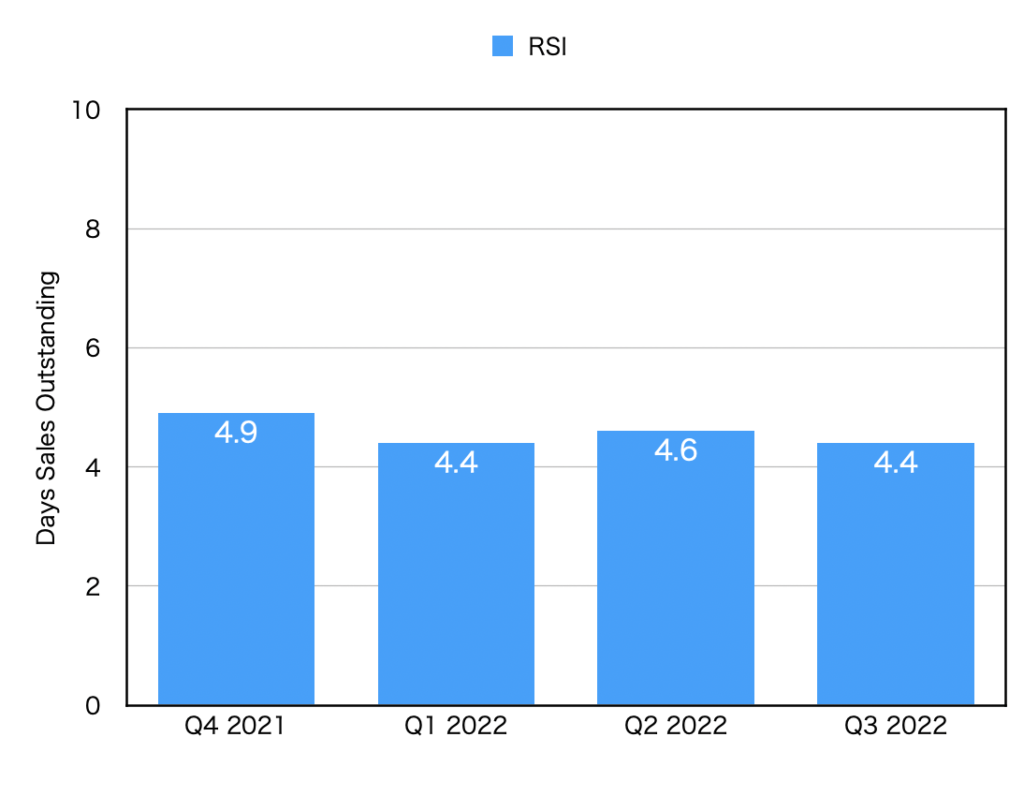
DSO(Days sales outstanding)
| DSO [day] | |
| Q4 2021 | 4.9 |
| Q1 2022 | 4.4 |
| Q2 2022 | 4.6 |
| Q3 2022 | 4.4 |