TOC
Introduction
The financial results of Spire Global, Inc is summarized in this page.
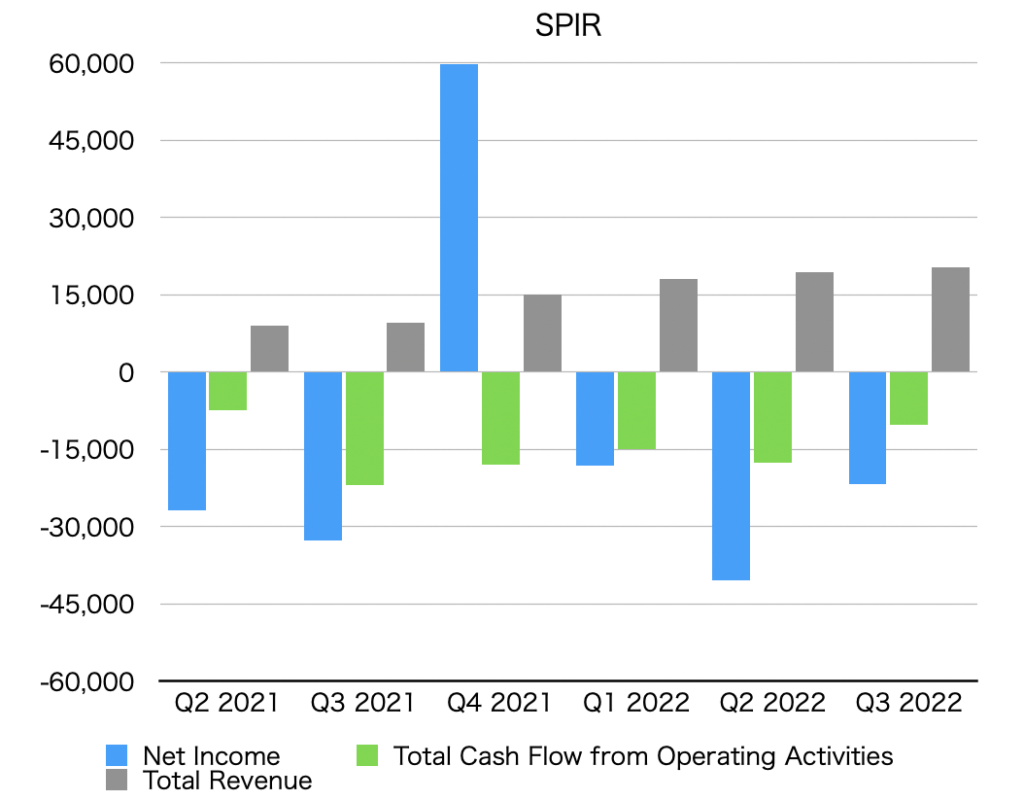
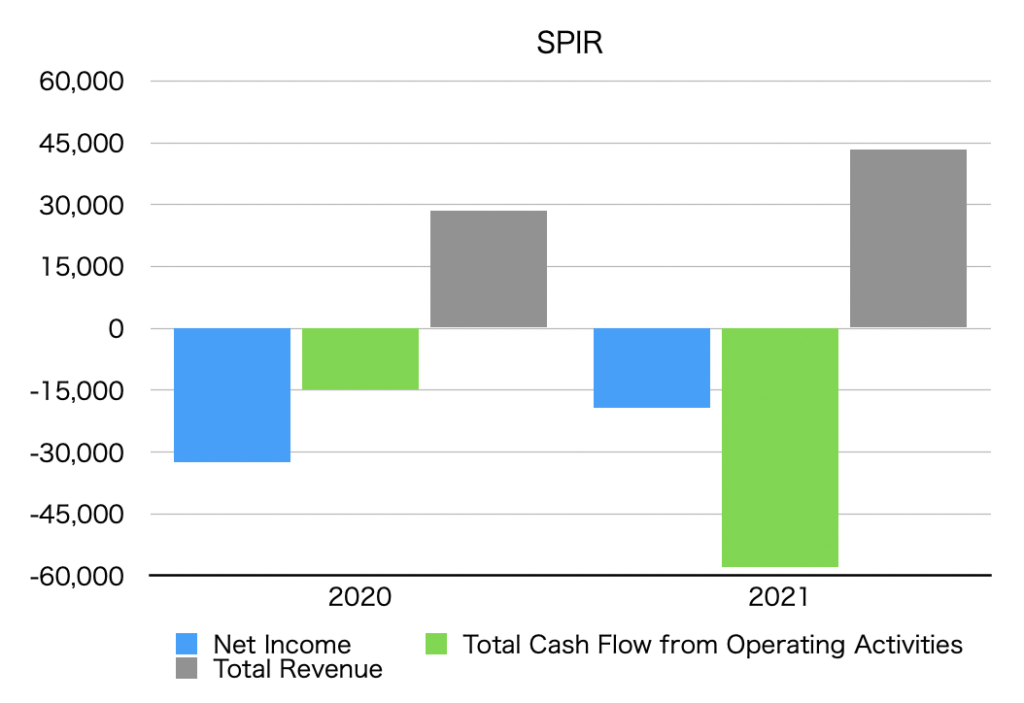
Summary of net income, operating cash flow, and total revenue (graph)
The unit is $1,000.
By quarter
By year
Net income
Net Income is below.
Quarterly data
| Net Income [$1,000] | |
| Q2 2021 | -26,862 |
| Q3 2021 | -32,701 |
| Q4 2021 | 59,949 |
| Q1 2022 | -18,158 |
| Q2 2022 | -40,455 |
| Q3 2022 | -21,811 |
Annual data
| Net Income [$1,000] | |
| 2020 | -32,504 |
| 2021 | -19,312 |
Operating cash flow
Total Cash Flow from Operating Activities is as follows.
Quarterly data
| Total Cash Flow from Operating Activities [$1,000] | |
| Q2 2021 | -7,307 |
| Q3 2021 | -21,880 |
| Q4 2021 | -17,978 |
| Q1 2022 | -14,991 |
| Q2 2022 | -17,503 |
| Q3 2022 | -10,214 |
Annual data
| Total Cash Flow from Operating Activities [$1,000] | |
| 2020 | -14,773 |
| 2021 | -57,986 |
Total revenue
Total revenue is below.
Quarterly data
| Total Revenue [$1,000] | |
| Q2 2021 | 9,113 |
| Q3 2021 | 9,561 |
| Q4 2021 | 14,985 |
| Q1 2021 | 18,070 |
| Q2 2022 | 19,395 |
| Q3 2022 | 20,418 |
Annual data
| Total Revenue [$1,000] | |
| 2020 | 28,490 |
| 2021 | 43,375 |
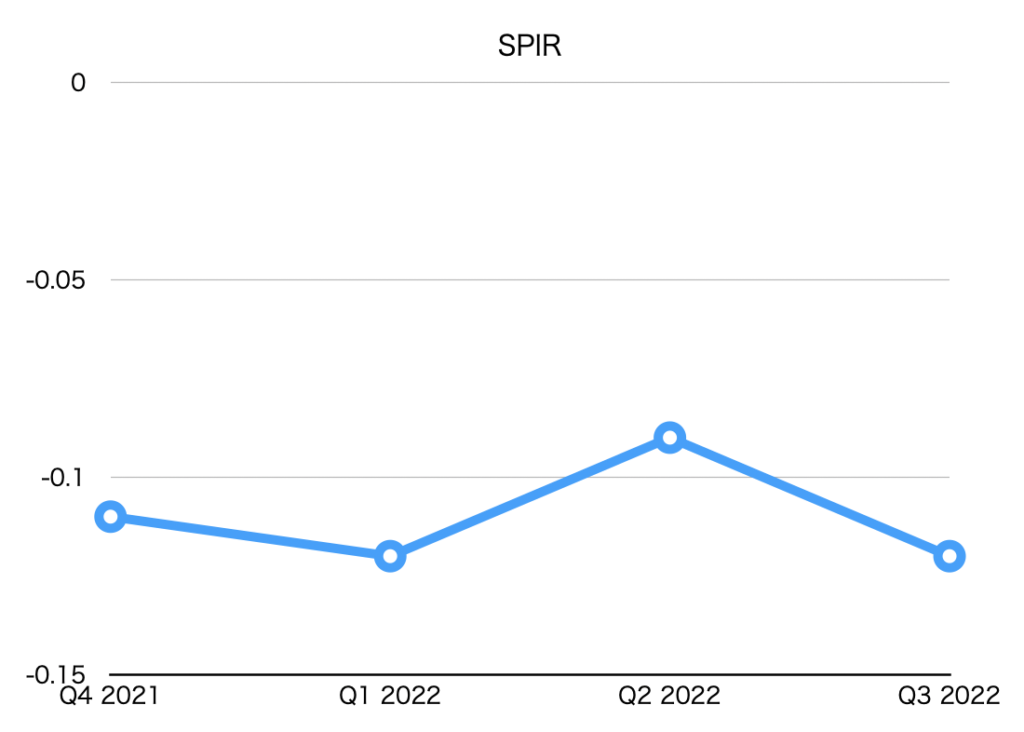
EPS (Net earnings per share)
| EPS [$] | |
| Q4 2021 | -0.11 |
| Q1 2022 | 0.12 |
| Q2 2022 | 0.09 |
| Q3 2022 | 0.12 |
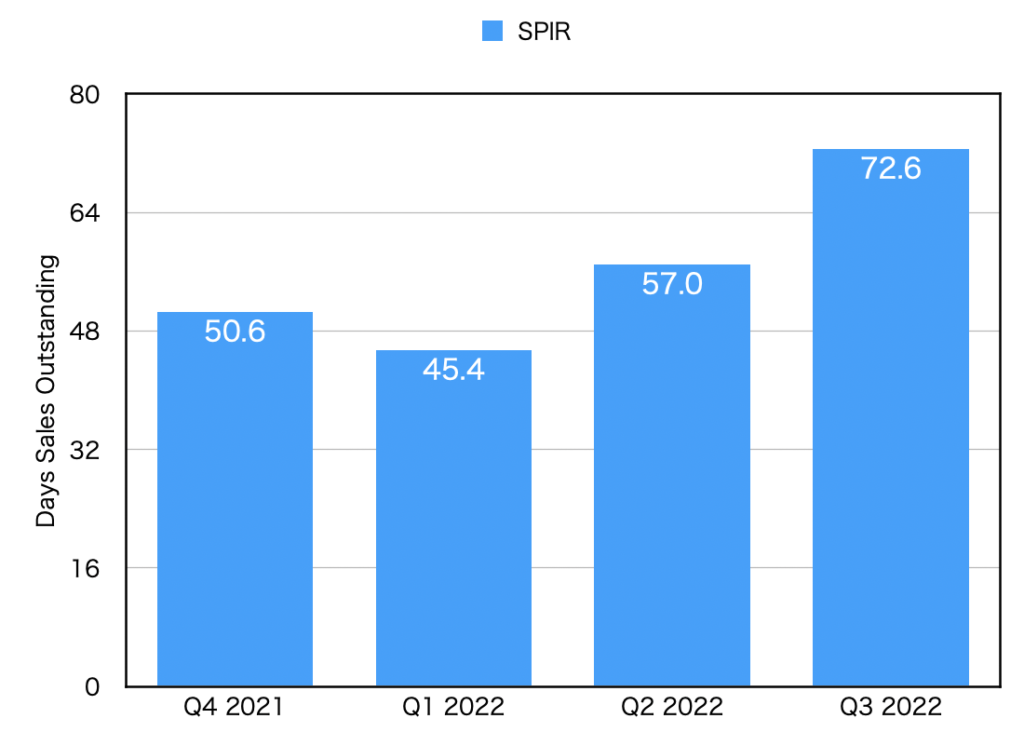
DSO(Days sales outstanding)
| DSO [day] | |
| Q4 2021 | 50.6 |
| Q1 2022 | 45.4 |
| Q2 2022 | 57.0 |
| Q3 2022 | 72.6 |
Revenue by region
The unit is $1,000.
スクロールできます