TOC
Introduction
The financial results of Planet Labs PBC is summarized in this page.
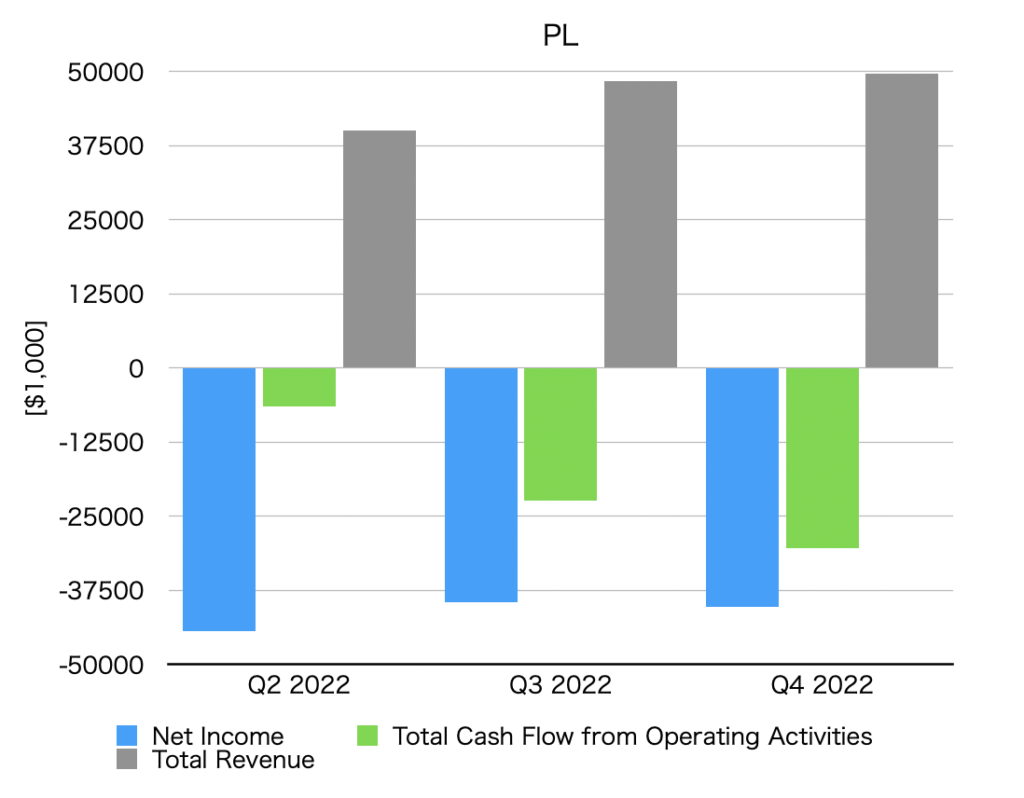
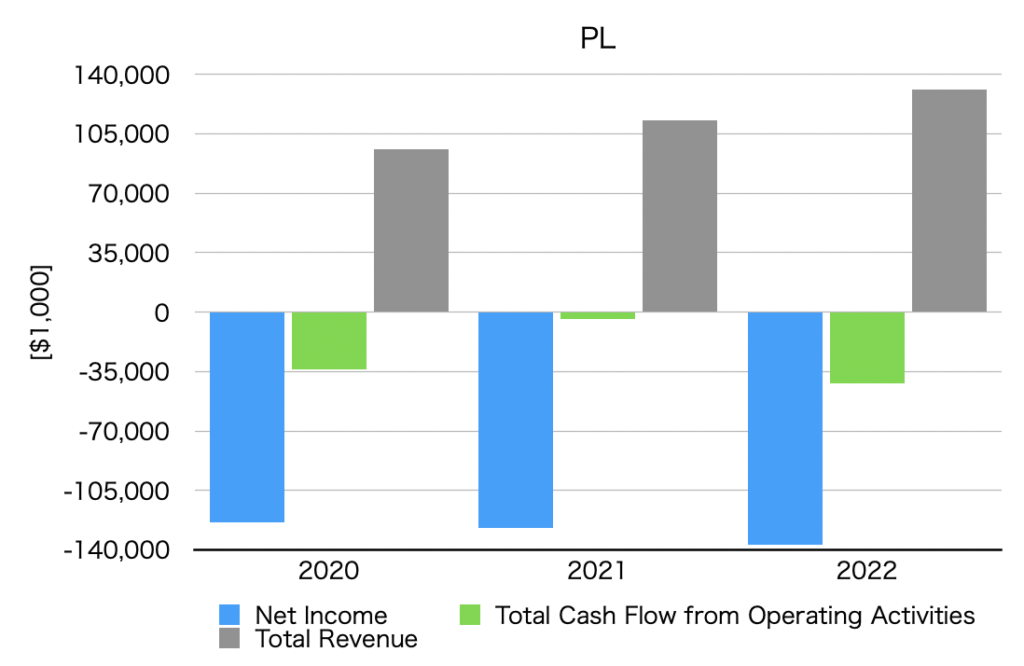
Summary of net income, operating cash flow, and total revenue (graph)
By quarter
By year
Net income
Net Income is below.
Quarterly data
| Net Income [$1,000] | |
| Q2 2022 | -44,360 |
| Q3 2022 | -39,529 |
| Q4 2022 | -40,236 |
Annual data
| Net Income [$1,000] | |
| 2020 | -123,714 |
| 2021 | -127,103 |
| 2022 | -137,124 |
Operating cash flow
Total Cash Flow from Operating Activities is as follows.
Quarterly data
| Total Cash Flow from Operating Activities [$1,000] | |
| Q2 2022 | -6,534 |
| Q3 2022 | -22,270 |
| Q4 2022 | -30,310 |
Annual data
| Total Cash Flow from Operating Activities [$1,000] | |
| 2020 | -33,687 |
| 2021 | -4,027 |
| 2022 | -42,211 |
Total revenue
Total revenue is below.
Quarterly data
| Total Revenue [$1,000] | |
| Q2 2022 | 40,127 |
| Q3 2022 | 48,450 |
| Q4 2022 | 49,704 |
Annual data
| Total Revenue [$1,000] | |
| 2020 | 95,736 |
| 2021 | 113,168 |
| 2022 | 131,209 |
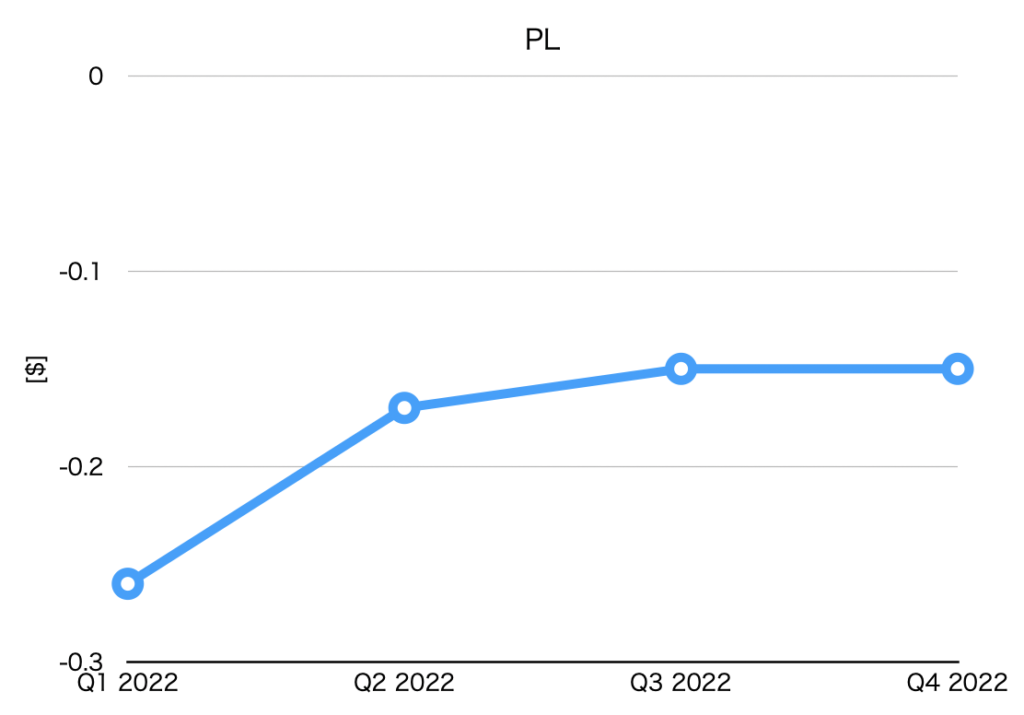
EPS (Net earnings per share)
| EPS [$] | |
| Q1 2022 | -0.26 |
| Q2 2022 | -0.17 |
| Q3 2022 | -0.15 |
| Q4 2022 | -0.15 |
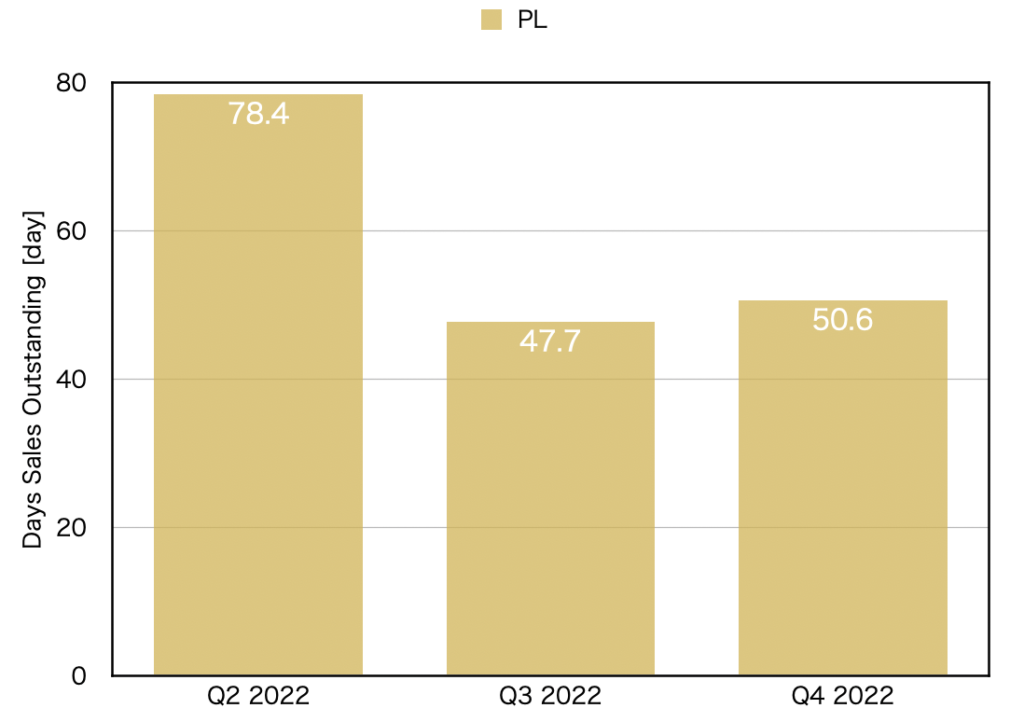
DSO(Days sales outstanding)
| DSO [day] | |
| Q2 2022 | 78.4 |
| Q3 2022 | 47.7 |
| Q4 2022 | 50.6 |
Revenue by region
The unit is $1,000.
スクロールできます
| United States | Norway | Canada | Rest of World | |
| Q2 2022 | 18,752 | 1,785 | 3,976 | 15,614 |
スクロールできます
| United States | Norway | Rest of World | |
| Q3 2022 | 25,729 | 1,769 | 20,952 |
| Q4 2022 | 27,191 | 3,226 | 19,287 |