Introduction
The financial results of Lincoln Electric Holdings, Inc is summarized in this page.
Company profile
Lincoln Electric Holdings, Inc. is a publicly traded company based in Cleveland, Ohio, USA, that specializes in the design, manufacture, and sale of welding and cutting products, systems, and solutions. The company is a global leader in the welding industry and has a long history of providing welding technologies and solutions for a wide range of industries and applications.
Lincoln Electric offers a diverse portfolio of welding and cutting products, including welding electrodes, welding wire, welding machines, consumables, and related accessories. The company’s products are used in various welding processes, such as arc welding, gas welding, and laser welding, and are designed for use in a wide range of materials, including steel, aluminum, stainless steel, and other alloys.
In addition to its welding and cutting products, Lincoln Electric provides comprehensive welding solutions, including automation and integration systems, welding training and education, and technical support services. The company serves customers in various industries, including automotive, construction, oil and gas, power generation, shipbuilding, aerospace, and many others.
Lincoln Electric has a long history dating back to its founding in 1895 and has become a globally recognized brand in the welding industry. The company is known for its commitment to innovation, quality, and customer service, and has received numerous awards and recognition for its products and solutions. With a global presence, Lincoln Electric operates manufacturing facilities, sales offices, and technical support centers in over 160 countries, providing welding solutions to customers around the world.
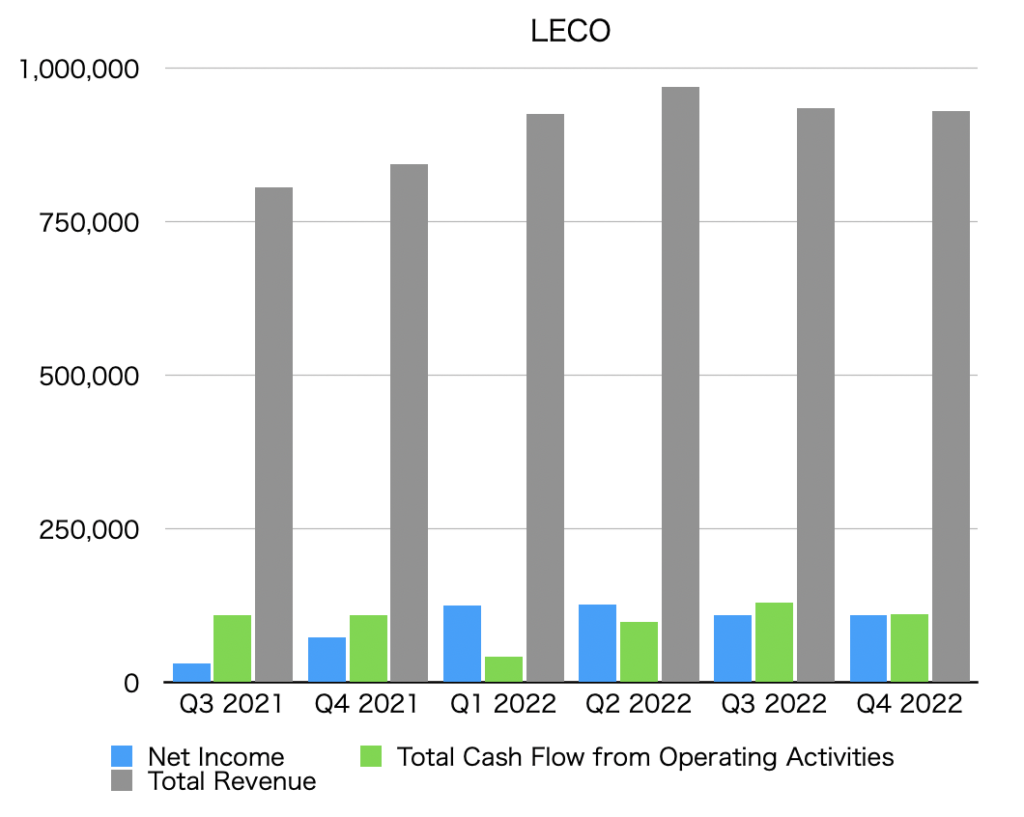
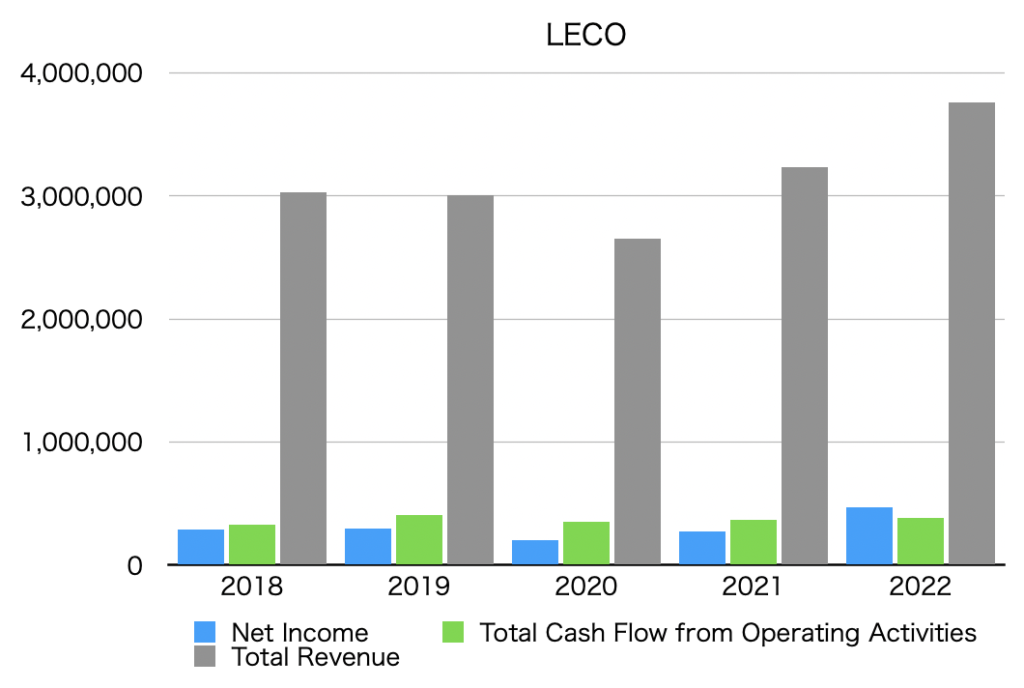
Summary of net income, operating cash flow, and total revenue (graph)
The unit is $1,000.
By quarter
By year
Net income
Net Income is below.
Quarterly data
| Net Income [$1,000] | |
| Q3 2021 | 31,757 |
| Q4 2021 | 74,427 |
| Q1 2022 | 126,030 |
| Q2 2022 | 127,823 |
| Q3 2022 | 109,225 |
| Q4 2022 | 109,146 |
Annual data
| Net Income [$1,000] | |
| 2018 | 287,066 |
| 2019 | 293,109 |
| 2020 | 206,115 |
| 2021 | 276,466 |
| 2022 | 472,224 |
Operating cash flow
Total Cash Flow from Operating Activities is as follows.
Quarterly data
| Total Cash Flow from Operating Activities [$1,000] | |
| Q3 2021 | 109,891 |
| Q4 2021 | 109,938 |
| Q1 2022 | 43,090 |
| Q2 2022 | 98,211 |
| Q3 2022 | 130,283 |
| Q4 2022 | 111,802 |
Annual data
| Total Cash Flow from Operating Activities [$1,000] | |
| 2018 | 329,152 |
| 2019 | 403,185 |
| 2020 | 351,362 |
| 2021 | 365,063 |
| 2022 | 383,386 |
Total revenue
Total revenue is below.
Quarterly data
| Total Revenue [$1,000] | |
| Q3 2021 | 806,454 |
| Q4 2021 | 844,251 |
| Q1 2021 | 925,448 |
| Q2 2022 | 969,589 |
| Q3 2022 | 935,240 |
| Q4 2022 | 930,934 |
Annual data
| Total Revenue [$1,000] | |
| 2018 | 3,028,674 |
| 2019 | 3,003,272 |
| 2020 | 2,665,400 |
| 2021 | 3,234,180 |
| 2022 | 3,761,211 |
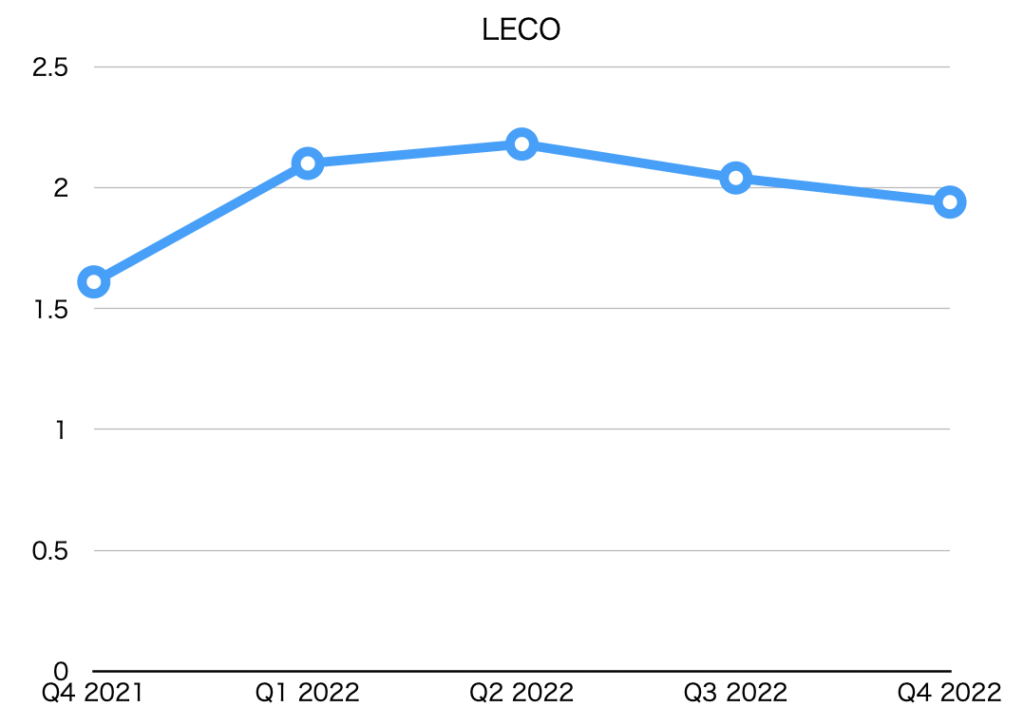
EPS (Net earnings per share)
| EPS [$] | |
| Q4 2021 | 1.61 |
| Q1 2022 | 2.10 |
| Q2 2022 | 2.18 |
| Q3 2022 | 2.04 |
| Q4 2022 | 1.94 |
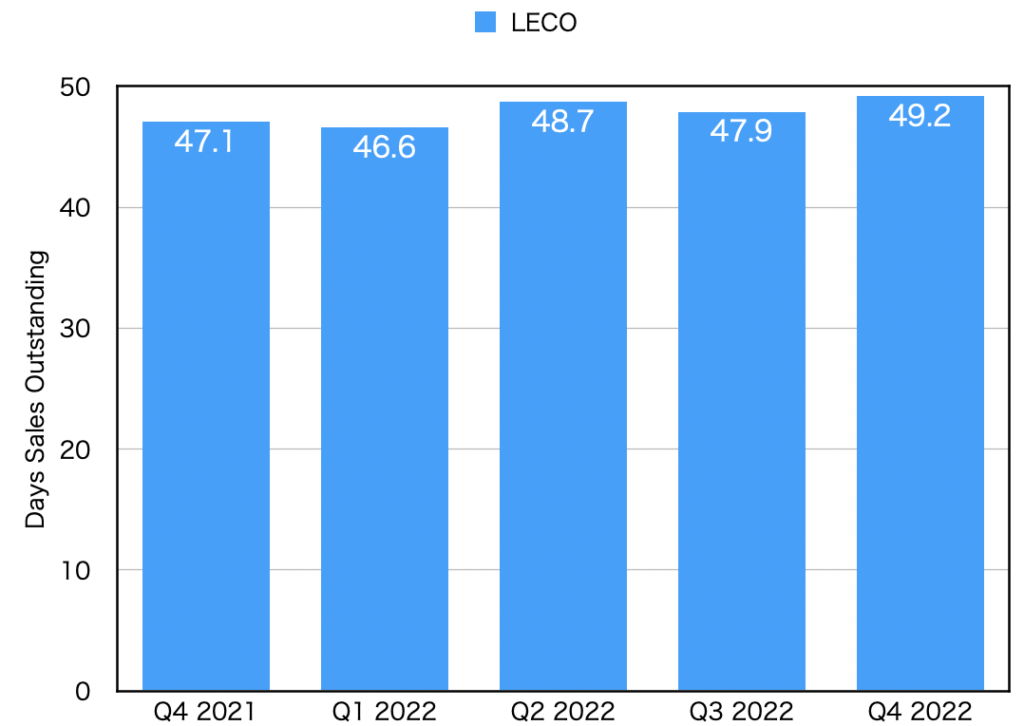
DSO(Days sales outstanding)
| DSO [day] | |
| Q4 2021 | 47.1 |
| Q1 2022 | 46.6 |
| Q2 2022 | 48.7 |
| Q3 2022 | 47.9 |
| Q4 2022 | 49.2 |