TOC
Introduction
The financial results of L3Harris Technologies, Inc is summarized in this page.
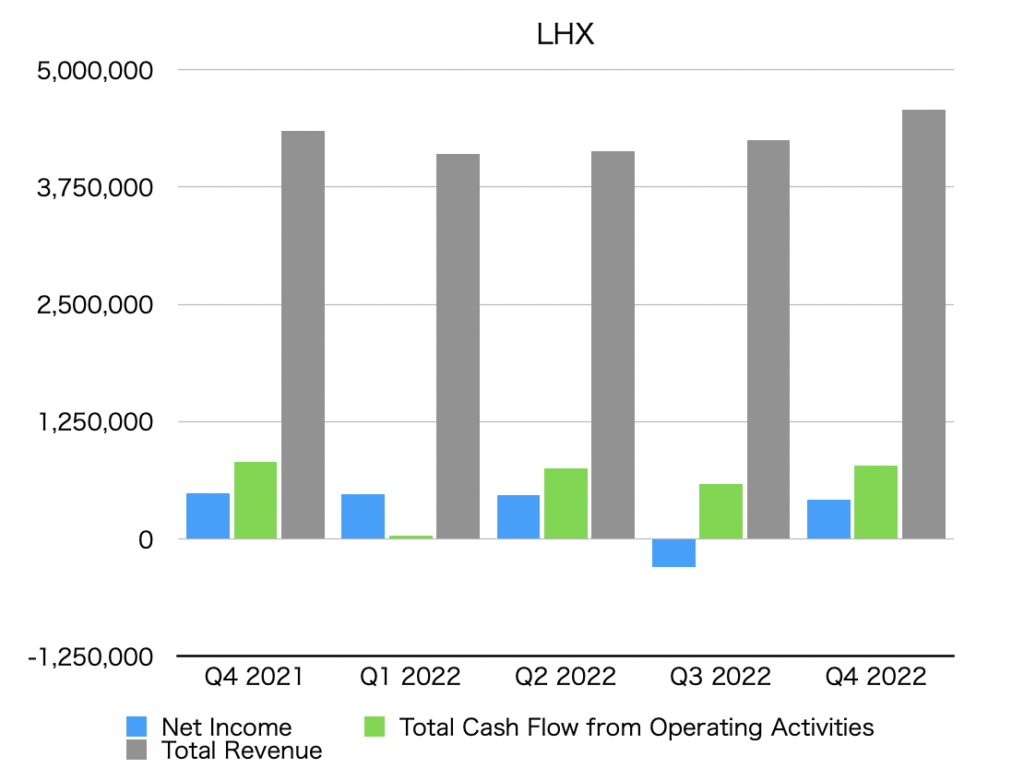
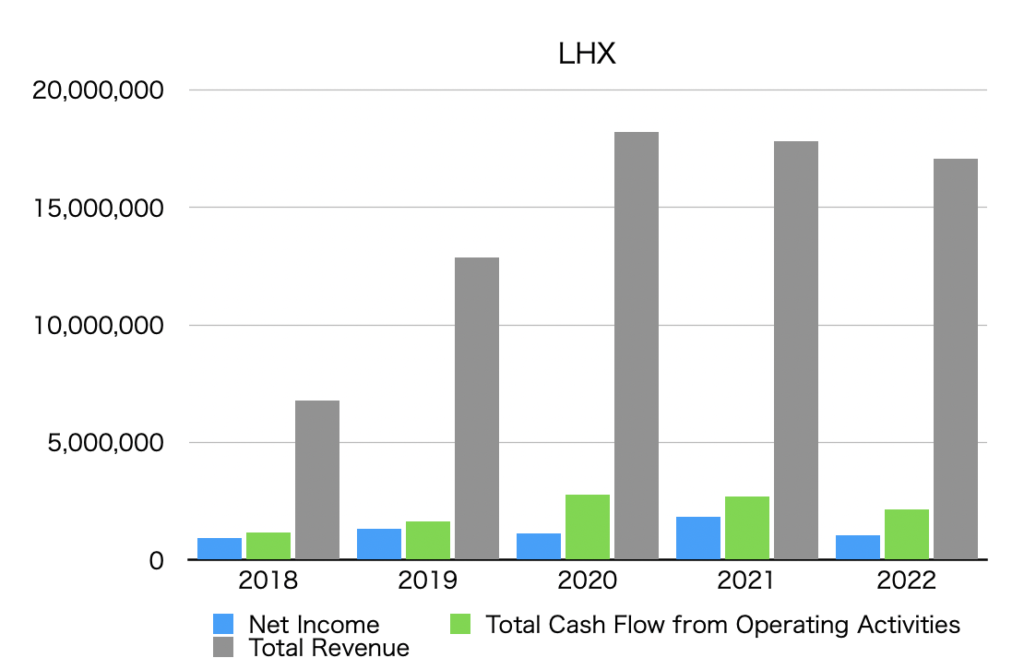
Summary of net income, operating cash flow, and total revenue (graph)
The unit is $1,000.
By quarter
By year
Net income
Net Income is below.
Quarterly data
| Net Income [$1,000] | |
| Q4 2021 | 484,000 |
| Q1 2022 | 475,000 |
| Q2 2022 | 471,000 |
| Q3 2022 | -300,000 |
| Q4 2022 | 416,000 |
Annual data
| Net Income [$1,000] | |
| 2018 | 949,000 |
| 2019 | 1,333,000 |
| 2020 | 1,119,000 |
| 2021 | 1,846,000 |
| 2022 | 1,062,000 |
Operating cash flow
Total Cash Flow from Operating Activities is as follows.
Quarterly data
| Total Cash Flow from Operating Activities [$1,000] | |
| Q4 2021 | 822,000 |
| Q1 2022 | 39,000 |
| Q2 2022 | 749,000 |
| Q3 2022 | 588,000 |
| Q4 2022 | 782,000 |
Annual data
| Total Cash Flow from Operating Activities [$1,000] | |
| 2018 | 1,185,000 |
| 2019 | 1,655,000 |
| 2020 | 2,790,000 |
| 2021 | 2,687,000 |
| 2022 | 2,158,000 |
Total revenue
Total revenue is below.
Quarterly data
| Total Revenue [$1,000] | |
| Q4 2021 | 4,350,000 |
| Q1 2021 | 4,103,000 |
| Q2 2022 | 4,135,000 |
| Q3 2022 | 4,246,000 |
| Q4 2022 | 4,578,000 |
Annual data
| Total Revenue [$1,000] | |
| 2018 | 6,801,000 |
| 2019 | 12,856,000 |
| 2020 | 18,194,000 |
| 2021 | 17,814,000 |
| 2022 | 17,062,000 |
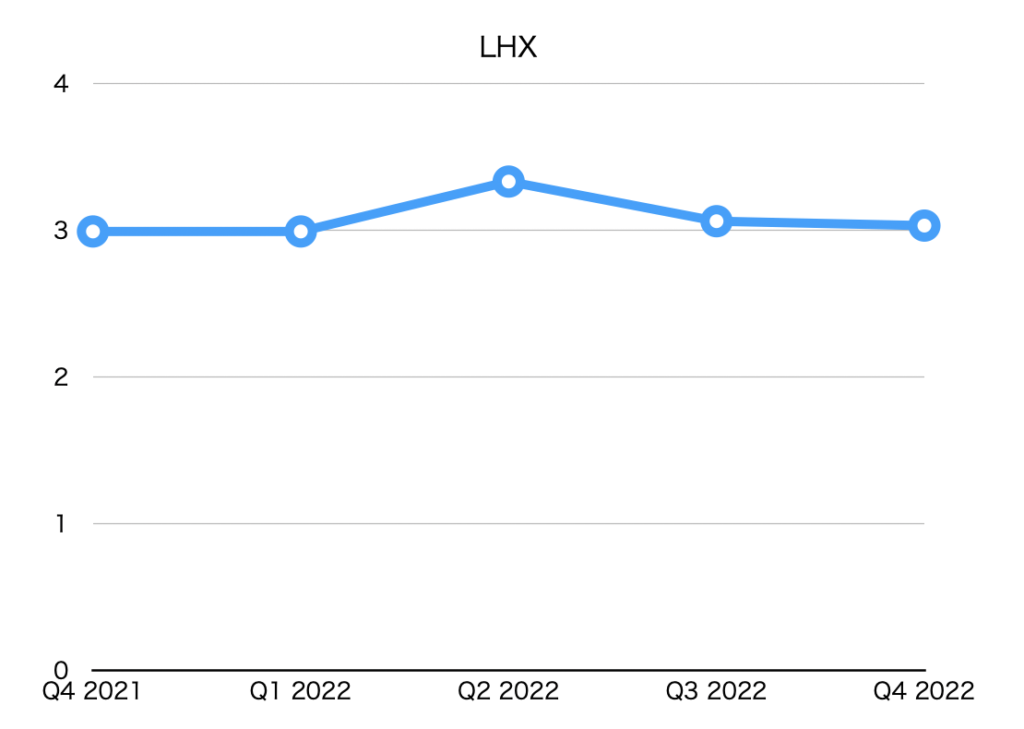
EPS (Net earnings per share)
| EPS [$] | |
| Q4 2021 | 2.99 |
| Q1 2022 | 2.99 |
| Q2 2022 | 3.33 |
| Q3 2022 | 3.06 |
| Q4 2022 | 3.03 |
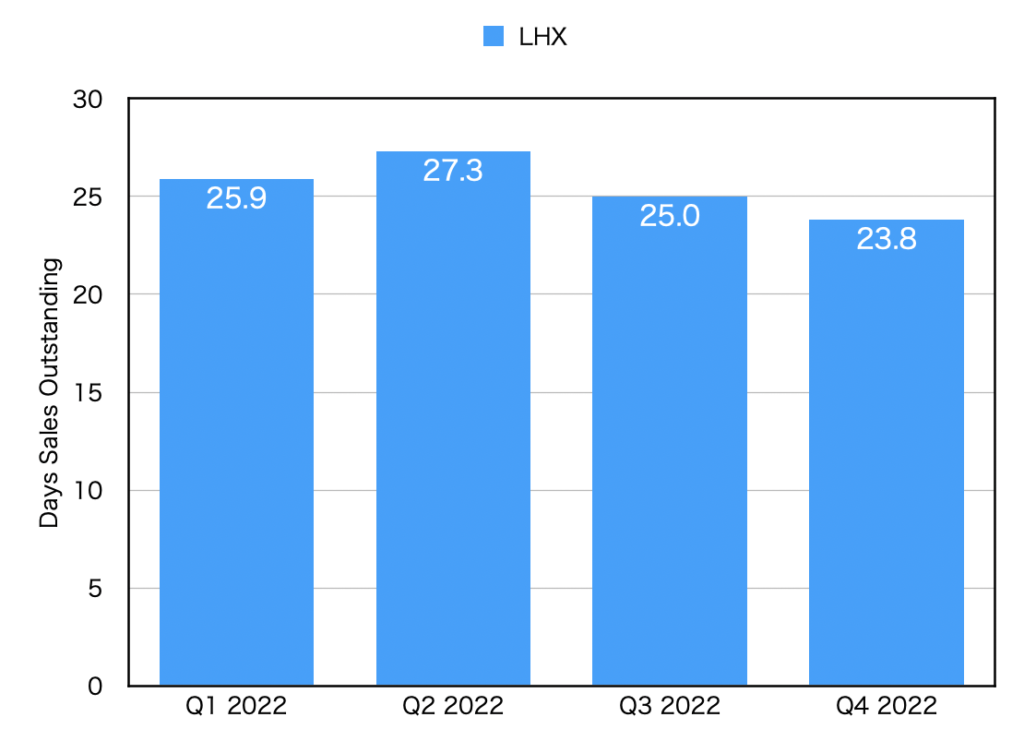
DSO(Days sales outstanding)
| DSO [day] | |
| Q1 2022 | 25.9 |
| Q2 2022 | 27.3 |
| Q3 2022 | 25.0 |
| Q4 2022 | 23.8 |