TOC
Introduction
The financial results of Virgin Orbit Holdings, Inc is summarized in this page.
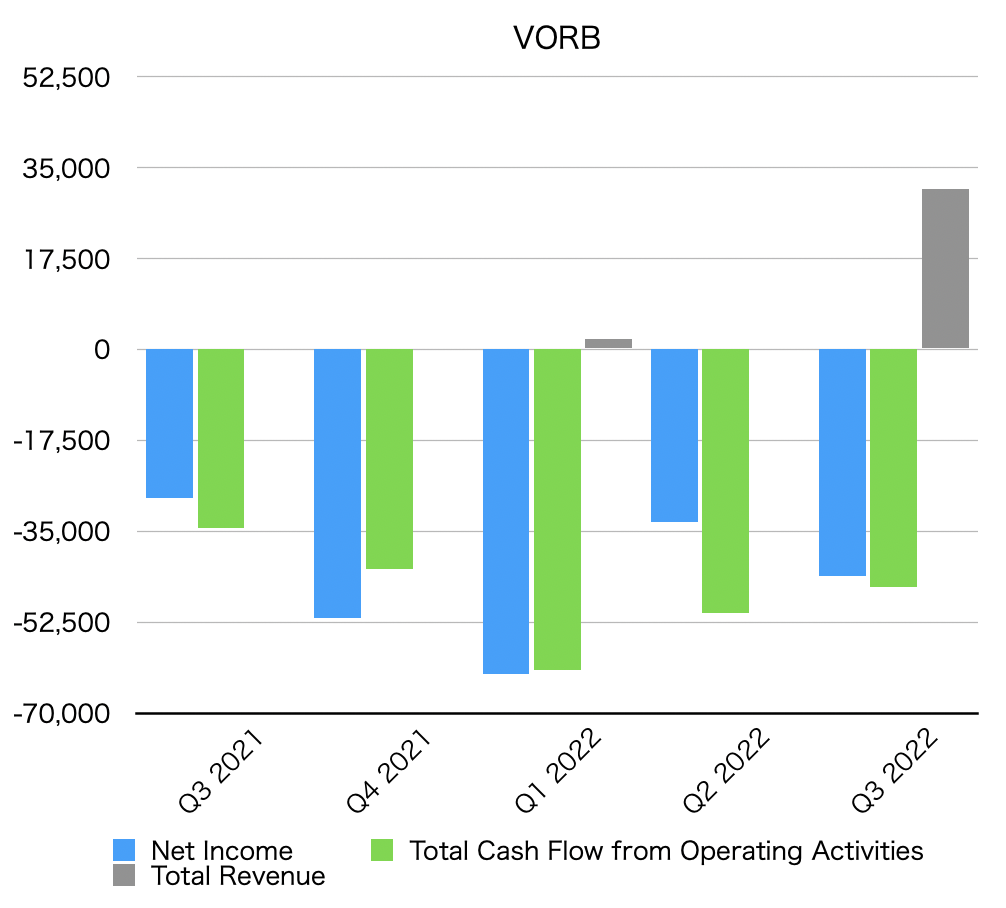
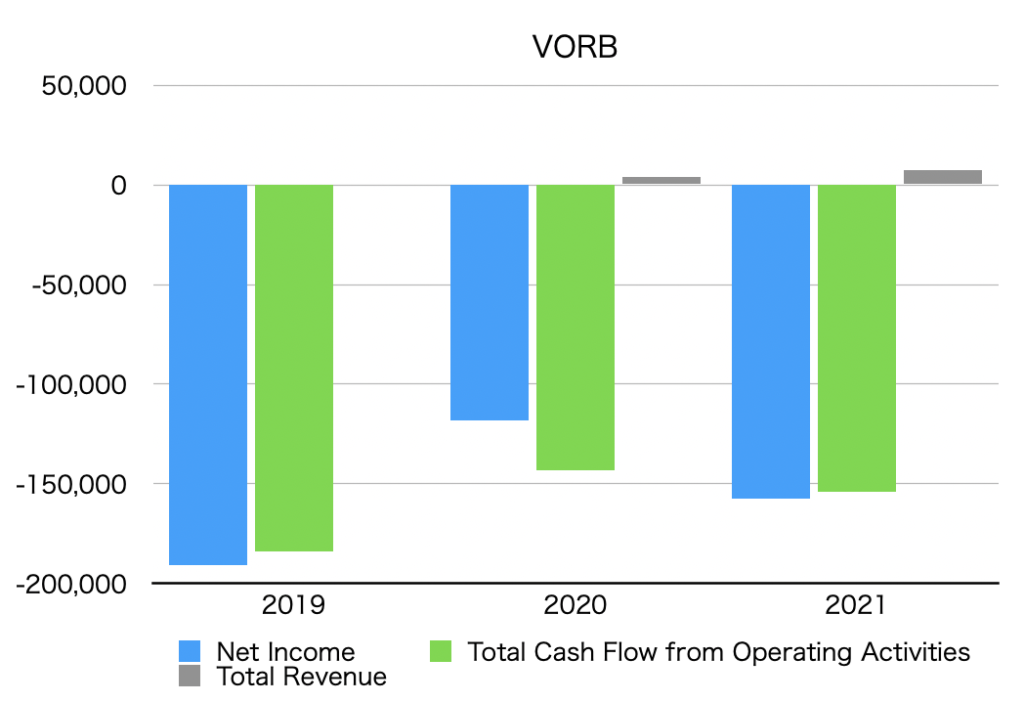
Summary of net income, operating cash flow, and total revenue (graph)
The unit is $1,000.
By quarter
By year
Net income
Net Income is below.
Quarterly data
| Net Income [$1,000] | |
| Q3 2021 | -28,531 |
| Q4 2021 | -51,787 |
| Q1 2022 | -62,570 |
| Q2 2022 | -33,292 |
| Q3 2022 | -43,643 |
Annual data
| Net Income [$1,000] | |
| 2019 | -190,968 |
| 2020 | -118,107 |
| 2021 | -157,291 |
Operating cash flow
Total Cash Flow from Operating Activities is as follows.
Quarterly data
| Total Cash Flow from Operating Activities [$1,000] | |
| Q3 2021 | -34,453 |
| Q4 2021 | -42,301 |
| Q1 2022 | -61,627 |
| Q2 2022 | -50,688 |
| Q3 2022 | -45,676 |
Annual data
| Total Cash Flow from Operating Activities [$1,000] | |
| 2019 | -183,919 |
| 2020 | -143,016 |
| 2021 | -153,997 |
Total revenue
Total revenue is below.
Quarterly data
| Total Revenue [$1,000] | |
| Q3 2021 | 2 |
| Q4 2021 | 155 |
| Q1 2021 | 2,111 |
| Q2 2022 | 5 |
| Q3 2022 | 30,907 |
Annual data
| Total Revenue [$1,000] | |
| 2019 | 477 |
| 2020 | 3,840 |
| 2021 | 7,385 |
EPS (Net earnings per share)
| EPS [$] | |
| Q3 2022 | -0.13 |
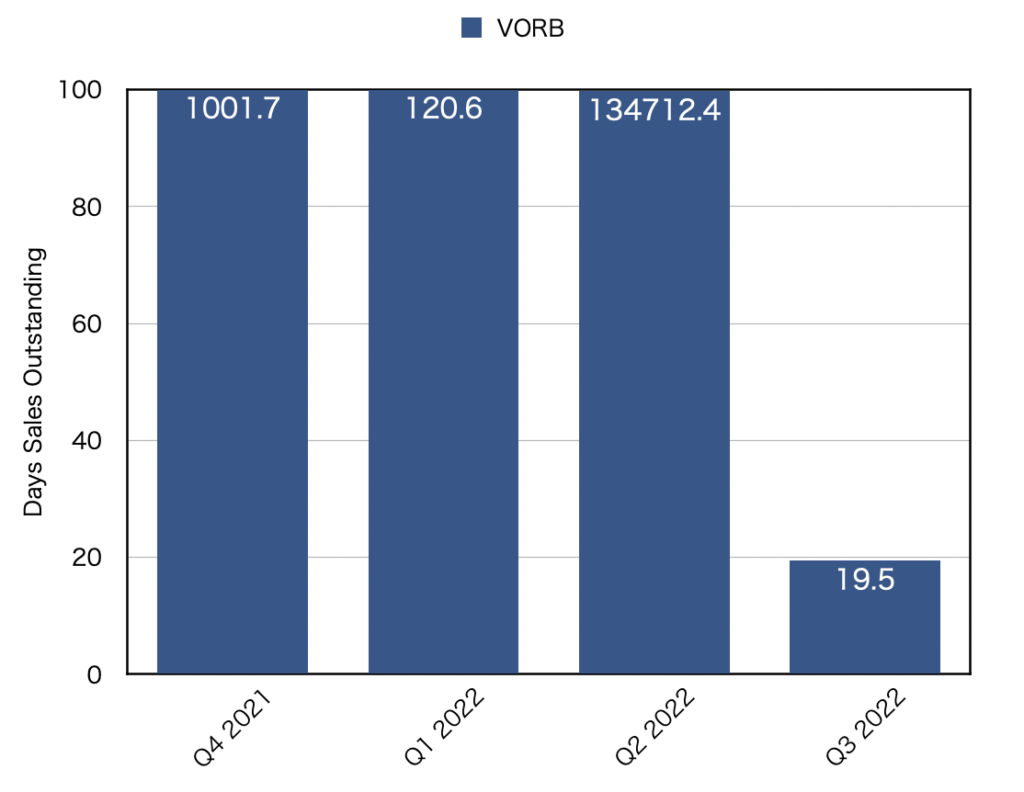
DSO(Days sales outstanding)
| DSO [day] | |
| Q4 2022 | 1001.7 |
| Q1 2022 | 120.6 |
| Q2 2022 | 134712.4 |
| Q3 2022 | 19.5 |