TOC
Introduction
The financial results of Driven Brands Holdings Inc. is summarized in this page.
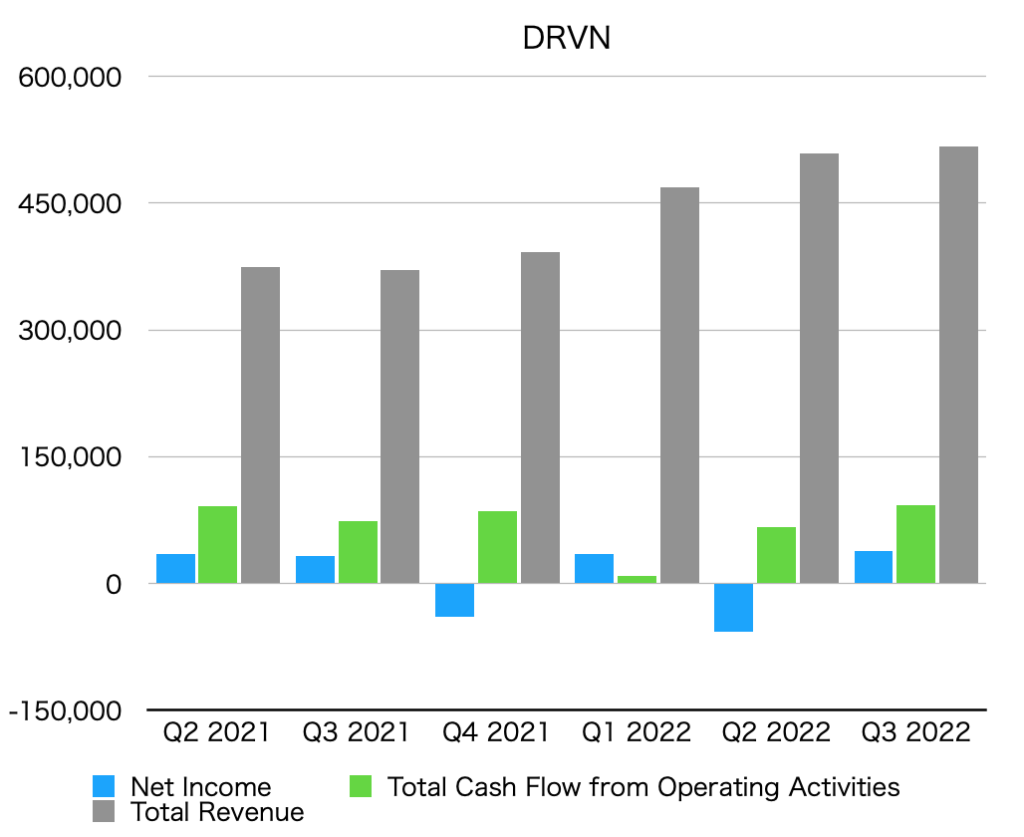
Summary of net income, operating cash flow, and total revenue (graph)
The unit is $1,000.
By quarter
By year
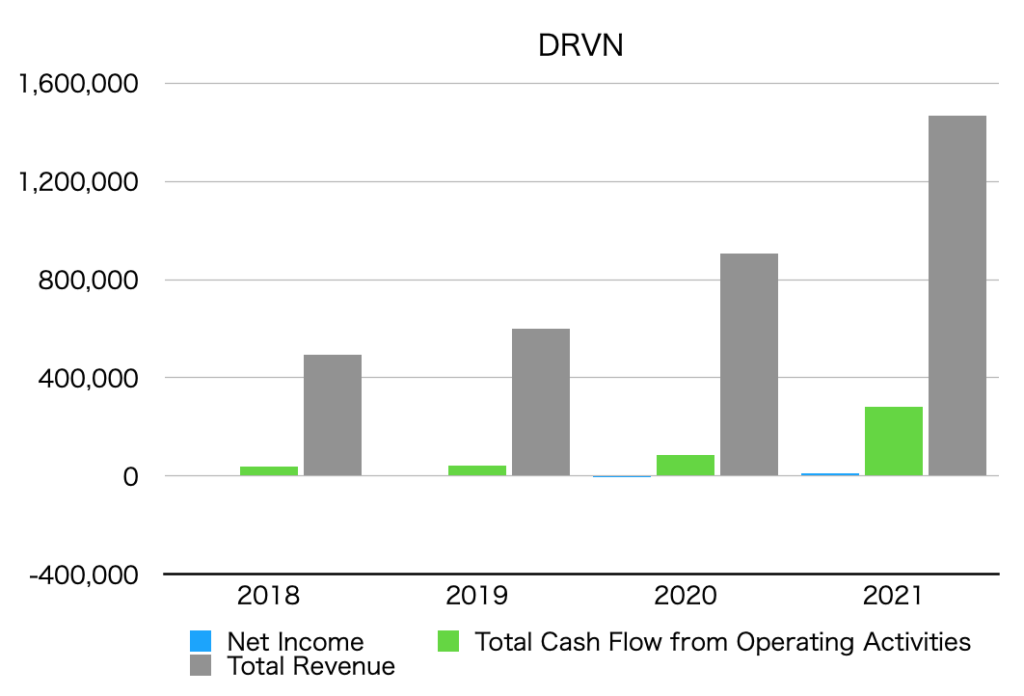
Net income
Net Income is below.
Quarterly data
| Net Income [$1,000] | |
| Q2 2021 | 35,204 |
| Q3 2021 | 33,124 |
| Q4 2021 | -38,757 |
| Q1 2022 | 34,443 |
| Q2 2022 | -57,044 |
| Q3 2022 | 38,391 |
Annual data
| Net Income [$1,000] | |
| 2018 | 7,062 |
| 2019 | 7,731 |
| 2020 | -4,199 |
| 2021 | 9,632 |
Operating cash flow
Total Cash Flow from Operating Activities is as follows.
Quarterly data
| Total Cash Flow from Operating Activities [$1,000] | |
| Q2 2021 | 92,102 |
| Q3 2021 | 73,507 |
| Q4 2021 | 85,632 |
| Q1 2022 | 9,040 |
| Q2 2022 | 66,349 |
| Q3 2022 | 92,263 |
Annual data
| Total Cash Flow from Operating Activities [$1,000] | |
| 2018 | 38,753 |
| 2019 | 41,372 |
| 2020 | 83,986 |
| 2021 | 283,827 |
Total revenue
Total revenue is below.
Quarterly data
| Total Revenue [$1,000] | |
| Q2 2021 | 374,828 |
| Q3 2021 | 371,148 |
| Q4 2021 | 391,885 |
| Q1 2022 | 468,323 |
| Q2 2022 | 508,624 |
| Q3 2022 | 516,594 |
Annual data
| Total Revenue [$1,000] | |
| 2018 | 492,715 |
| 2019 | 600,273 |
| 2020 | 904,200 |
| 2021 | 1,467,280 |
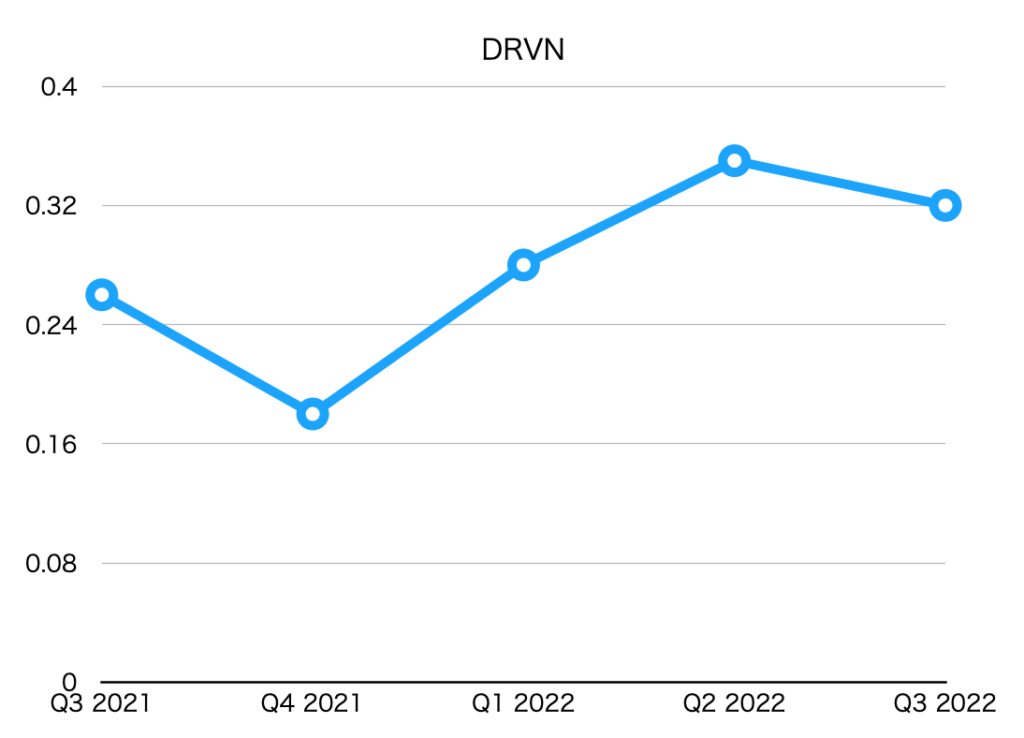
EPS (Net earnings per share)
| EPS [$] | |
| Q3 2021 | 0.26 |
| Q4 2021 | 0.18 |
| Q1 2022 | 0.28 |
| Q2 2022 | 0.35 |
| Q3 2022 | 0.32 |
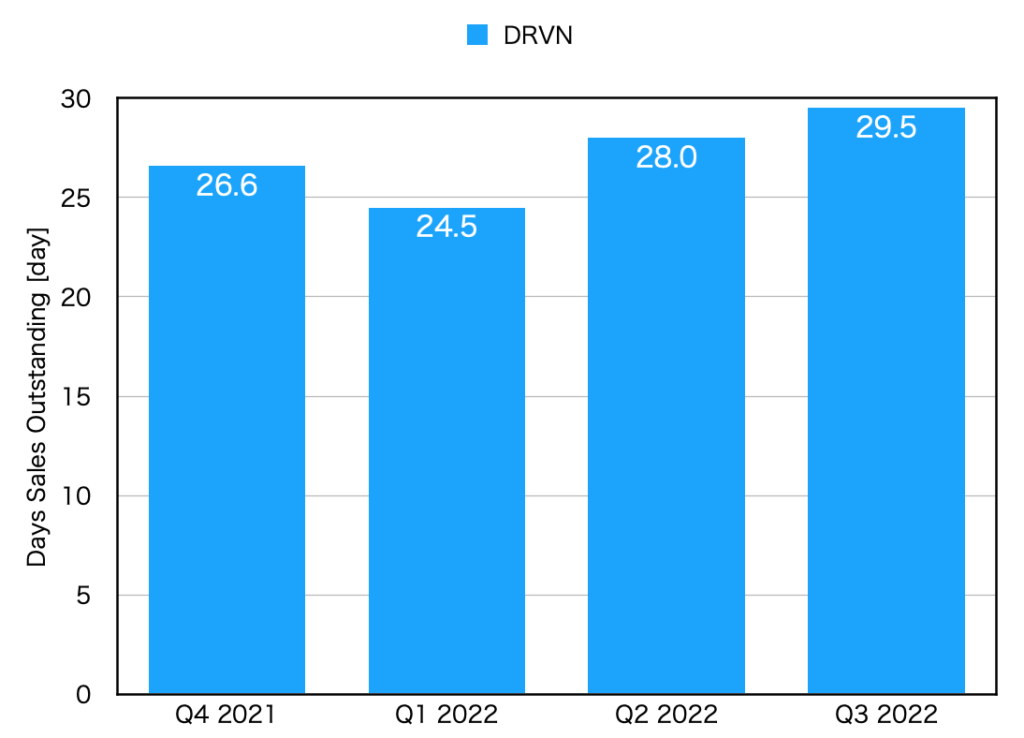
DSO(Days sales outstanding)
| DSO [day] | |
| Q4 2021 | 26.6 |
| Q1 2022 | 24.5 |
| Q2 2022 | 28.0 |
| Q3 2022 | 29.5 |