TOC
Introduction
The financial results of Roblox Corporation is summarized in this page.
Summary of net income, operating cash flow, and total revenue (graph)
The unit is $1,000.
By quarter
By year
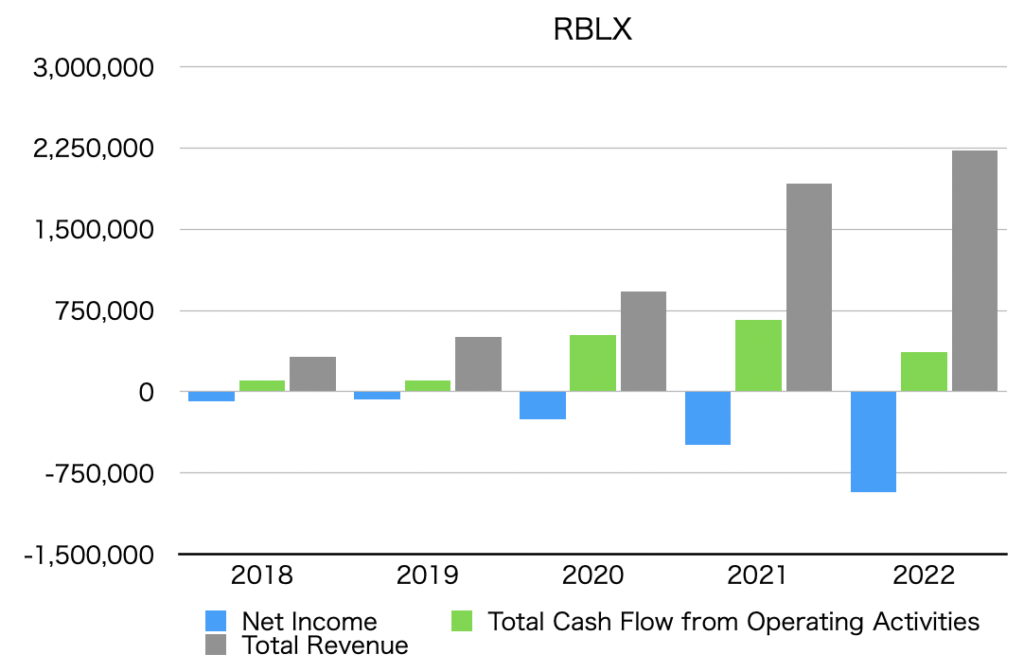
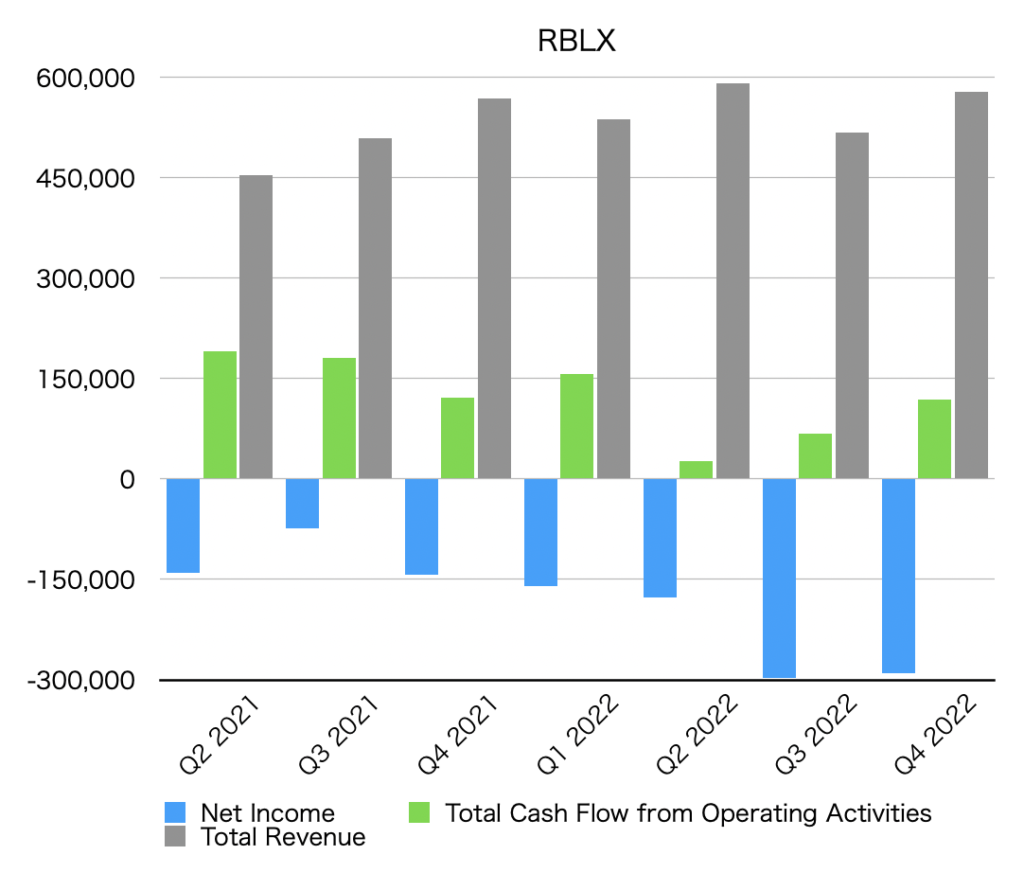
Net income
Net Income is below.
Quarterly data
| Net Income [$1,000] | |
| Q2 2021 | -140,134 |
| Q3 2021 | -74,002 |
| Q4 2021 | -143,298 |
| Q1 2022 | -160,202 |
| Q2 2022 | -176,440 |
| Q3 2022 | -297,798 |
| Q4 2022 | -289,926 |
Annual data
| Net Income [$1,000] | |
| 2018 | -88,075 |
| 2019 | -70,968 |
| 2020 | -253,254 |
| 2021 | -491,651 |
| 2022 | -924,366 |
Operating cash flow
Total Cash Flow from Operating Activities is as follows.
Quarterly data
| Total Cash Flow from Operating Activities [$1,000] | |
| Q2 2021 | 191,251 |
| Q3 2021 | 181,166 |
| Q4 2021 | 122,223 |
| Q1 2022 | 156,436 |
| Q2 2022 | 26,497 |
| Q3 2022 | 67,144 |
| Q4 2022 | 119,219 |
Annual data
| Total Cash Flow from Operating Activities [$1,000] | |
| 2018 | 101,038 |
| 2019 | 99,185 |
| 2020 | 524,340 |
| 2021 | 659,109 |
| 2022 | 369,296 |
Total revenue
Total revenue is below.
Quarterly data
| Total Revenue [$1,000] | |
| Q2 2021 | 454,100 |
| Q3 2021 | 509,336 |
| Q4 2021 | 568,769 |
| Q1 2022 | 537,134 |
| Q2 2022 | 591,207 |
| Q3 2022 | 517,707 |
| Q4 2022 | 579,004 |
Annual data
| Total Revenue [$1,000] | |
| 2018 | 324,956 |
| 2019 | 508,393 |
| 2020 | 923,885 |
| 2021 | 1,919,181 |
| 2022 | 2,225,052 |
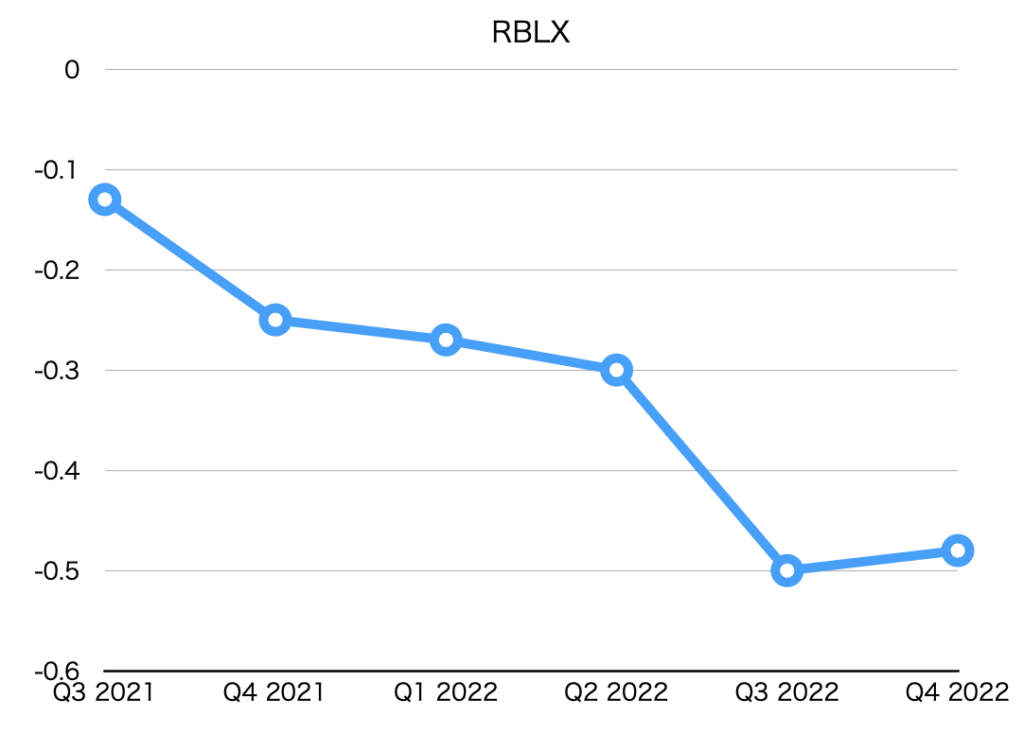
EPS (Net earnings per share)
| EPS [$] | |
| Q3 2021 | -0.13 |
| Q4 2021 | -0.25 |
| Q1 2022 | -0.27 |
| Q2 2022 | -0.30 |
| Q3 2022 | -0.50 |
| Q4 2022 | -0.48 |
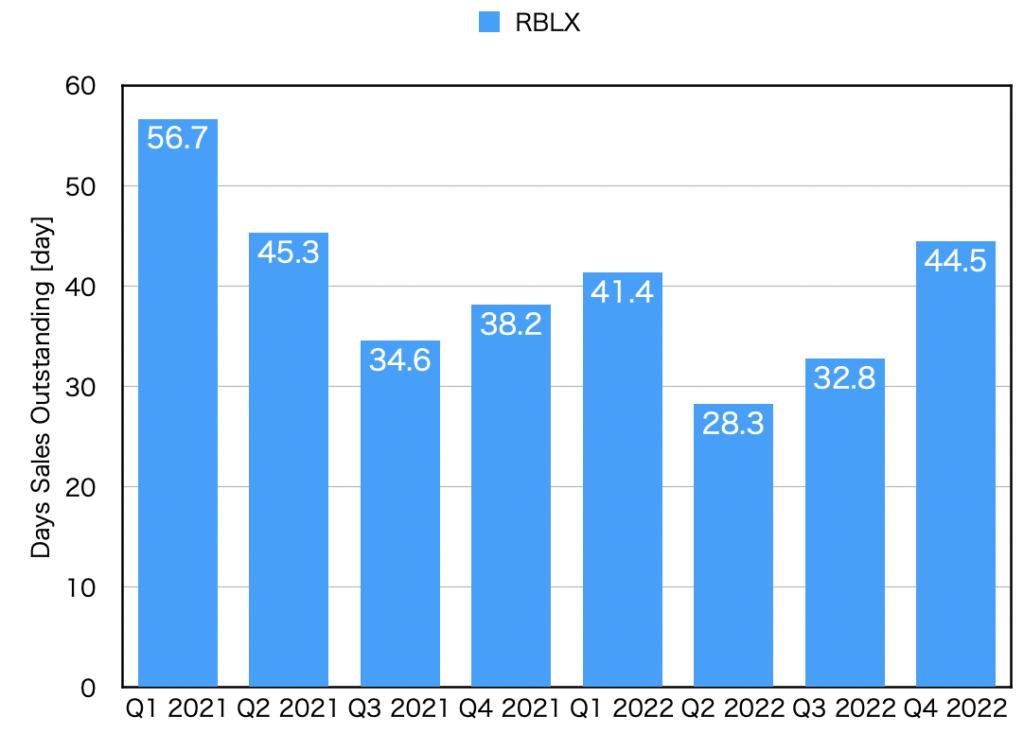
DSO(Days sales outstanding)
| DSO [day] | |
| Q1 2021 | 56.7 |
| Q2 2021 | 45.3 |
| Q3 2021 | 34.6 |
| Q4 2021 | 38.2 |
| Q1 2022 | 41.4 |
| Q2 2022 | 28.3 |
| Q3 2022 | 32.8 |
| Q4 2022 | 44.5 |