TOC
Introduction
The financial results of Airbnb, Inc is summarized in this page.
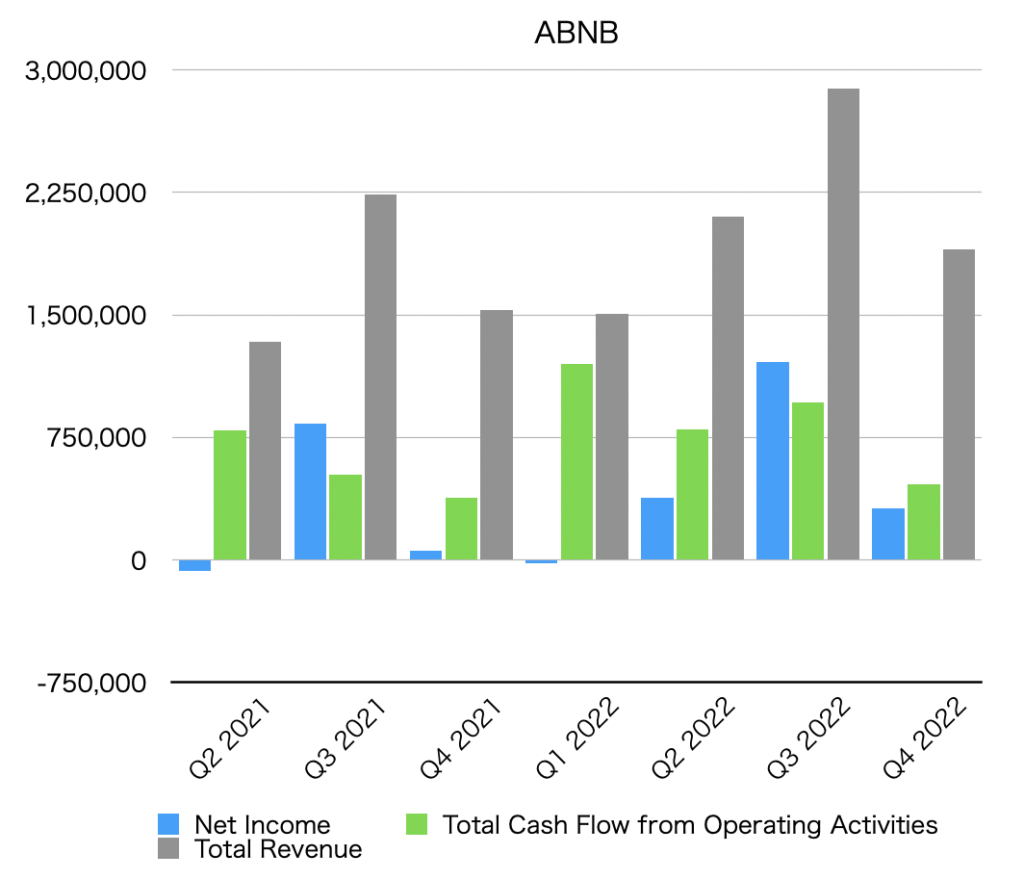
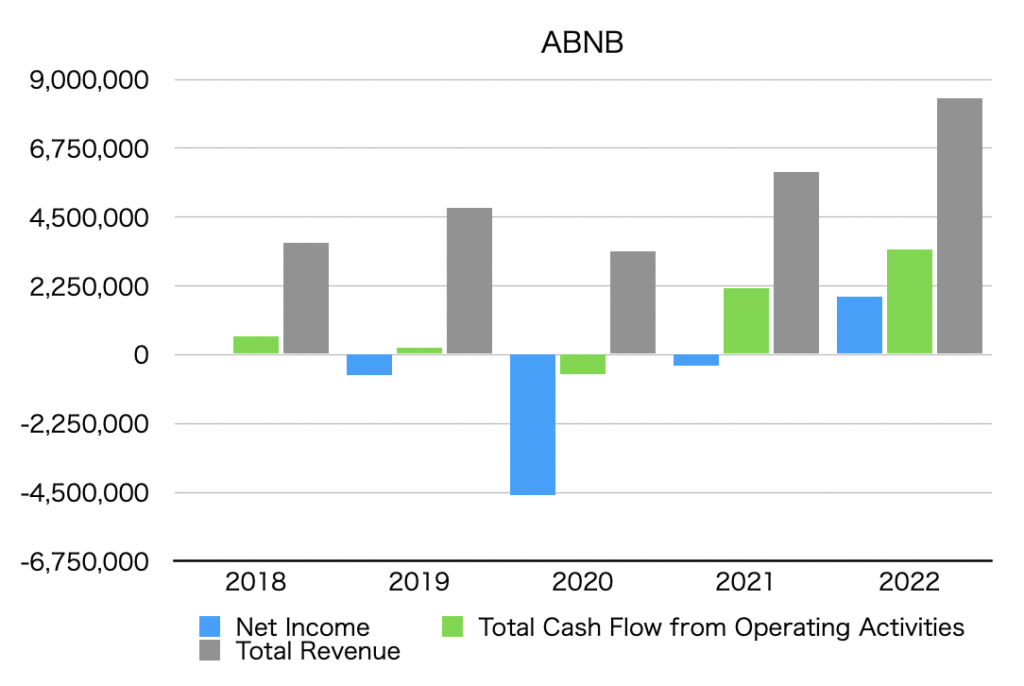
Summary of net income, operating cash flow, and total revenue (graph)
The unit is $1,000.
By quarter

By year
Net income
Net Income is below.
Quarterly data
| Net Income [$1,000] |
| Q2 2021 | -68,217 |
| Q3 2021 | 833,893 |
| Q4 2021 | 54,501 |
| Q1 2022 | -18,792 |
| Q2 2022 | 378,841 |
| Q3 2022 | 1,214,288 |
| Q4 2022 | 318,663 |
Annual data
| Net Income [$1,000] |
| 2018 | -16,860 |
| 2019 | -674,339 |
| 2020 | -4,584,716 |
| 2021 | -352,034 |
| 2022 | 1,893,000 |
Operating cash flow
Total Cash Flow from Operating Activities is as follows.
Quarterly data
| Total Cash Flow from Operating Activities [$1,000] |
| Q2 2021 | 791,299 |
| Q3 2021 | 523,178 |
| Q4 2021 | 380,849 |
| Q1 2022 | 1,201,992 |
| Q2 2022 | 799,747 |
| Q3 2022 | 965,563 |
| Q4 2022 | 462,698 |
Annual data
| Total Cash Flow from Operating Activities [$1,000] |
| 2018 | 595,557 |
| 2019 | 222,727 |
| 2020 | -629,732 |
| 2021 | 2,189,694 |
| 2022 | 3,430,000 |
Total revenue
Total revenue is below.
Quarterly data
| Total Revenue [$1,000] |
| Q2 2021 | 1,335,196 |
| Q3 2021 | 2,237,432 |
| Q4 2021 | 1,532,196 |
| Q1 2021 | 1,508,937 |
| Q2 2022 | 2,104,107 |
| Q3 2022 | 2,884,410 |
| Q4 2022 | 1,901,546 |
Annual data
| Total Revenue [$1,000] |
| 2018 | 3,651,985 |
| 2019 | 4,805,239 |
| 2020 | 3,378,199 |
| 2021 | 5,991,760 |
| 2022 | 8,399,000 |
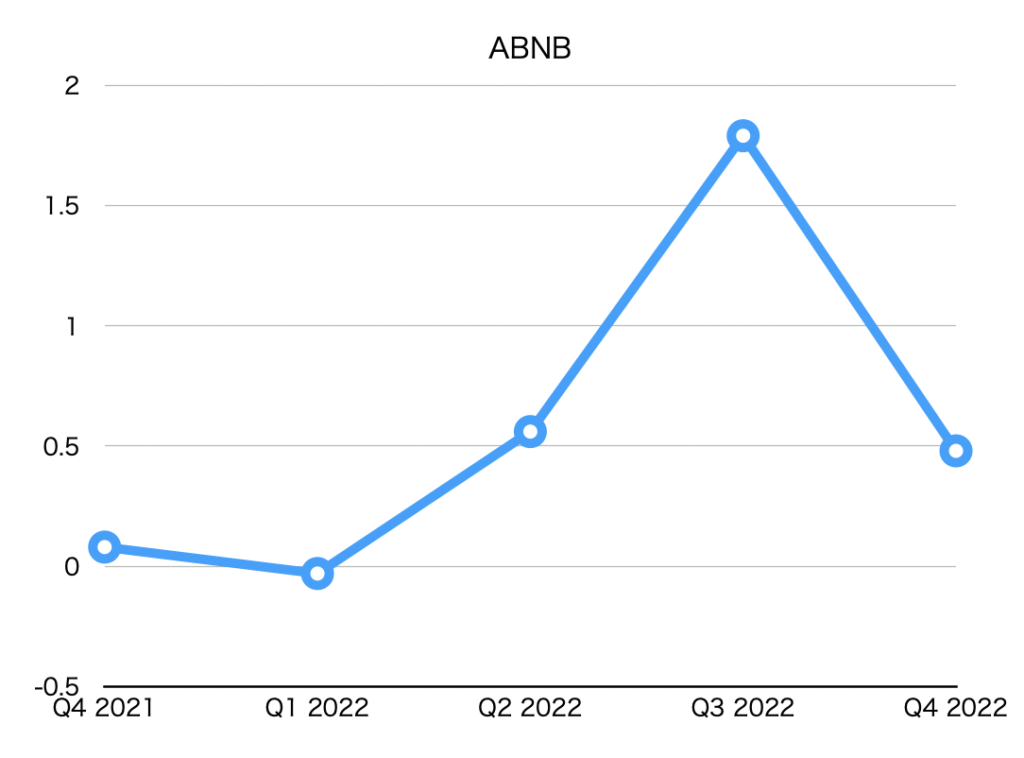
EPS (Net earnings per share)
| EPS [$] |
| Q4 2021 | 0.08 |
| Q1 2022 | -0.03 |
| Q2 2022 | 0.56 |
| Q3 2022 | 1.79 |
| Q4 2022 | 0.48 |
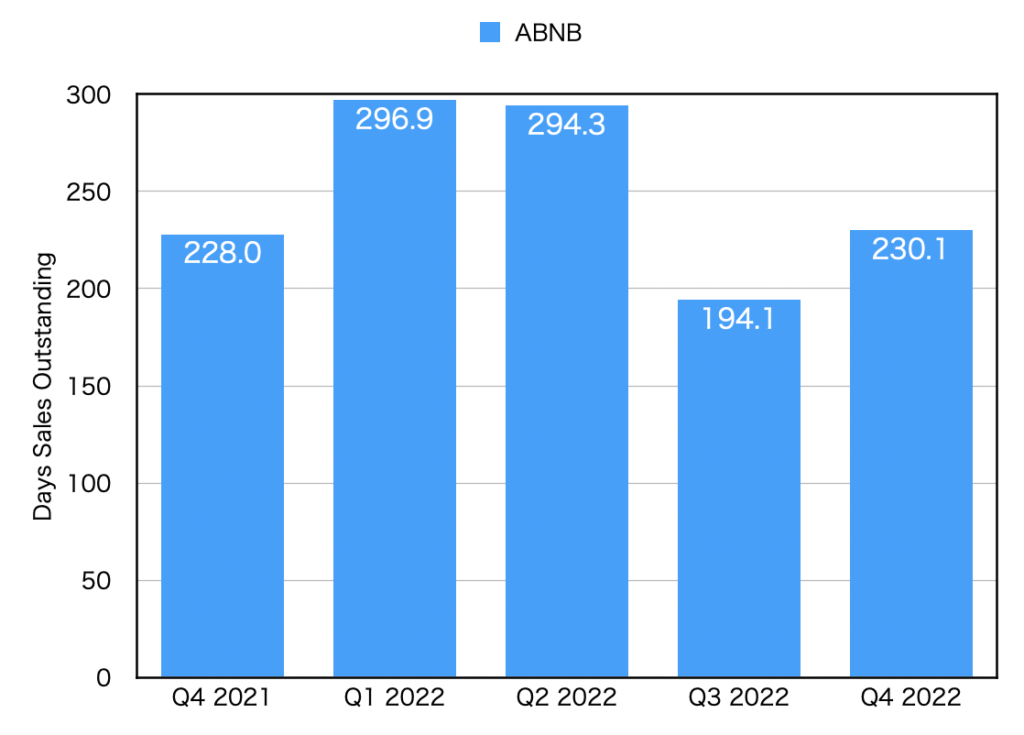
DSO(Days sales outstanding)
| DSO [day] |
| Q4 2021 | 228.0 |
| Q1 2022 | 296.9 |
| Q2 2022 | 294.3 |
| Q3 2022 | 194.1 |
| Q4 2022 | 230.1 |