The financial results of BlackSky Technology Inc. are summarized on this page.
Company profile
BlackSky is a geospatial intelligence company that provides global monitoring services and insights about the Earth’s surface using a combination of satellite imagery, artificial intelligence, and other data sources. The company’s technology enables users to monitor and analyze a range of global events, including weather patterns, natural disasters, and geopolitical developments, in near real-time. BlackSky’s customers include government agencies, businesses, and non-governmental organizations, and its services have applications in a wide range of industries, including defense and security, energy, and finance.
Summary of net income, operating cash flow, and total revenue (graph)
The unit is $1,000.
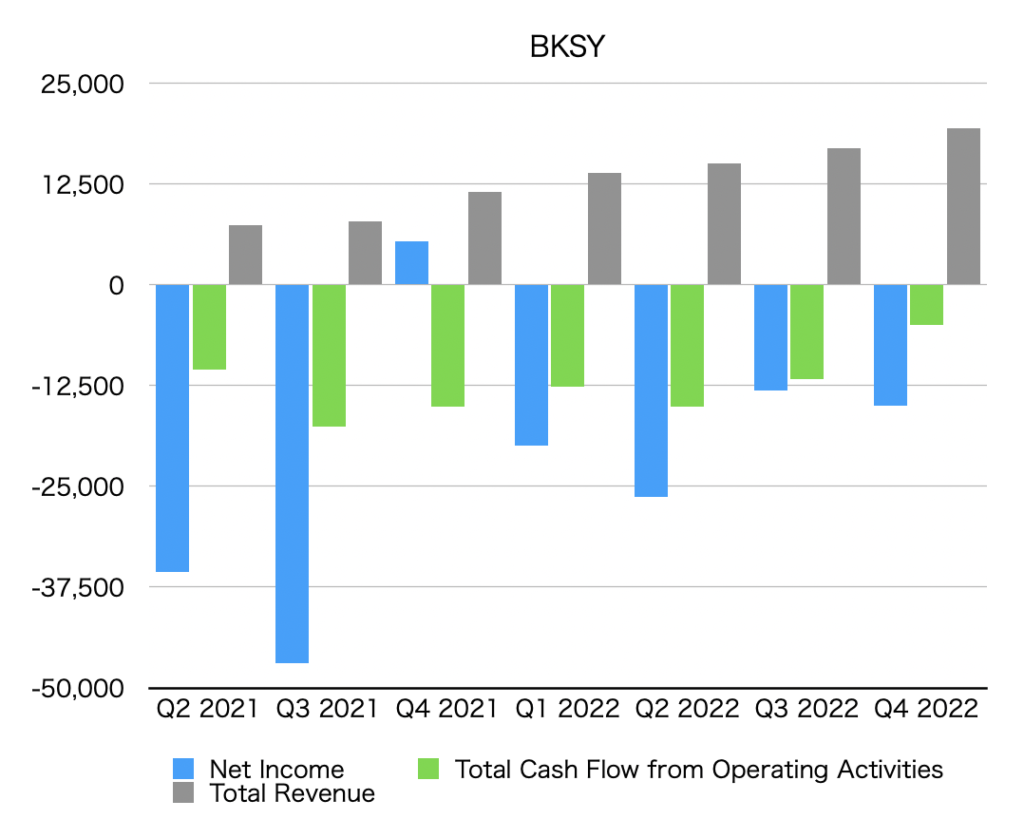
By Quarter
Net income, total cash flow from operating activities, and total revenue by quarter (BKSY).
Ottaka
Total revenue is trending steadily upward. We cannot confirm any such trend for net income and operating cash flow. (Sept. 03, 2022)
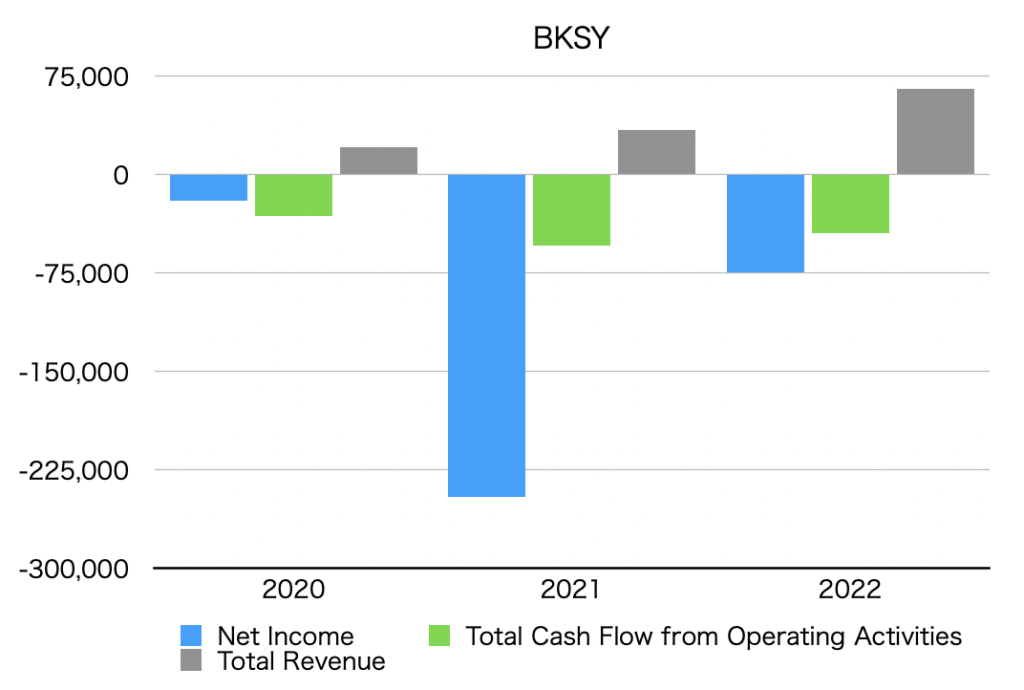
By year
Net income, total cash flow from operating activities, and total revenue by year (BKSY).
Net income
Net Income is below.
Quarterly data
Net Income [$1,000]
Q2 2021
-35,585
Q3 2021
-46,897
Q4 2021
5,395
Q1 2022
-19,988
Q2 2022
-26,278
Q3 2022
-13,048
Q4 2022
-14,975
Annual data
Net Income [$1,000]
2020
-19,535
2021
-245,643
2022
-74,342
Operating cash flow
The Total Cash Flow from Operating Activities is as follows.
Quarterly data
Total Cash Flow from Operating Activities [$1,000]
Q2 2021
-10,529
Q3 2021
-17,630
Q4 2021
-15,130
Q1 2022
-12,676
Q2 2022
-15,113
Q3 2022
-11,640
Q4 2022
-5,027
Annual data
Total Cash Flow from Operating Activities [$1,000]
2020
-31,674
2021
-53,872
2022
-44,456
Total revenue
Total revenue is below.
Quarterly data
Total Revenue [$1,000]
Growth rate *YoY [%]
Q2 2021
7,365
Q3 2021
7,937
Q4 2021
11,489
Q1 2022
13,896
Q2 2022
15,102
+105
Q3 2022
16,935
+113
Q4 2022
19,417
+69
Annual data
Total Revenue [$1,000]
Growth rate *YoY [%]
2020
21,135
2021
34,085
+61
2022
65,350
+92
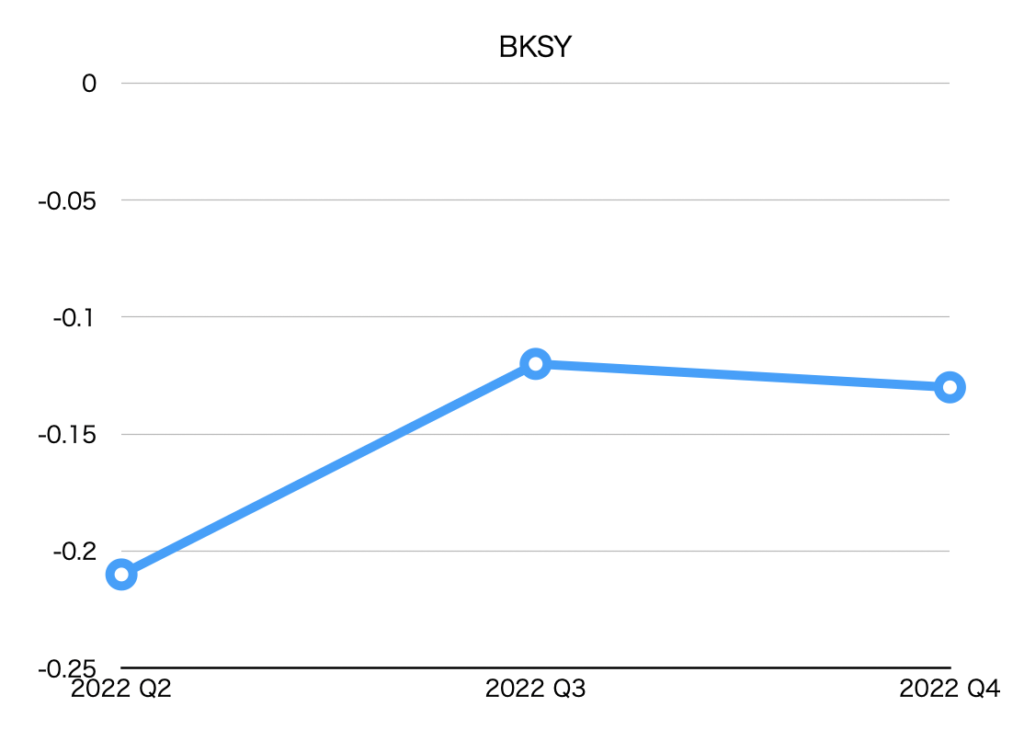
EPS (Net earnings per share)
EPS [$]
Q2 2022
-0.21
Q3 2022
-0.11
Q4 2022
-0.13
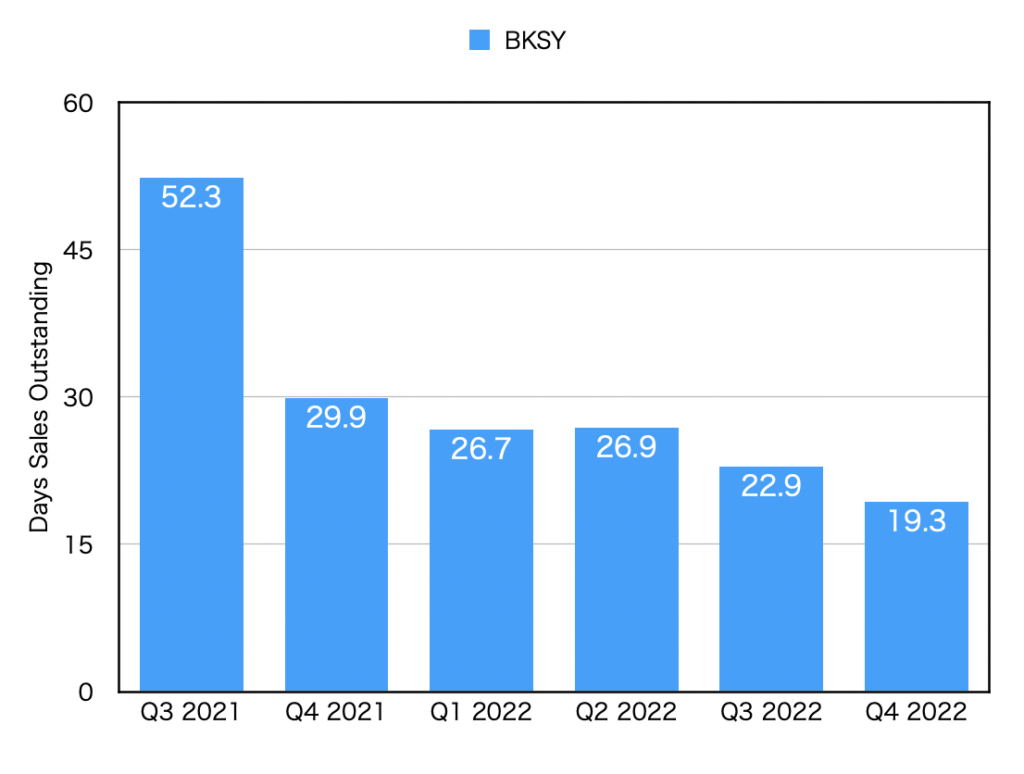
DSO(Days sales outstanding)
DSO [day]
Q3 2021
52.3
Q4 2021
29.9
Q1 2022
26.7
Q2 2022
26.9
Q3 2022
22.9
Q4 2022
19.3
Days Sales Outstanding (BKSY).
Revenue by region
The unit is $1,000.
スクロールできます
US
Middle East
Asia
Other
Q1 2022
11,147
594
1,994
161
Q2 2022
12,437
782
1,584
299
Q3 2022
14,996
969
10
960
Q4 2022
15,472
1,114
2,658
173
Revenue by region (BKSY).
Revenue by customer attributes
The unit is $1,000.
スクロールできます
U.S. federal government and agencies
International government
Commercial and other
Q1 2022
11,063
2,745
88
Q2 2022
12,162
2,742
198
Q3 2022
14,858
1,822
255
Q4 2022
15,103
4,066
248
Revenue by customer attributes (BKSY).
Revenue by each service
The unit is $1,000.
スクロールできます
Imagery
Data, software and analytics
Engineering & integration
Q1 2022
3,610
6,162
4,124
Q2 2022
6,833
6,517
1,752
Q3 2022
10,769
4,222
1,944
Revenue by each service (BKSY).
スクロールできます
Imagery
Data, software and analytics
Engineering services
Professional services
2021
8,648
6,717
9,039
9,681
2022
34,242
13,173
9,372
8,563
Revenue by each service (BKSY).
Ottaka
I am keeping a close eye on how much data, software, and analytics will grow in the future.
 Ottaka