Introduction
The financial results of BlackSky Technology Inc. are summarized on this page.
Company profile
BlackSky is a geospatial intelligence company that provides global monitoring services and insights about the Earth’s surface using a combination of satellite imagery, artificial intelligence, and other data sources. The company’s technology enables users to monitor and analyze a range of global events, including weather patterns, natural disasters, and geopolitical developments, in near real-time. BlackSky’s customers include government agencies, businesses, and non-governmental organizations, and its services have applications in a wide range of industries, including defense and security, energy, and finance.
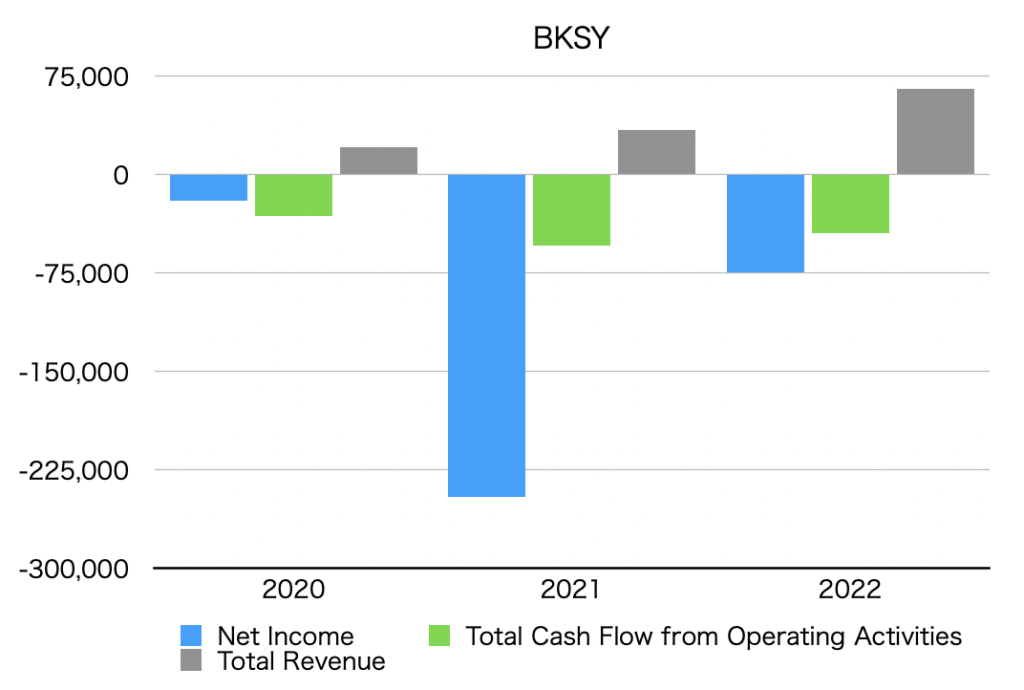
Summary of net income, operating cash flow, and total revenue (graph)
The unit is $1,000.
By Quarter
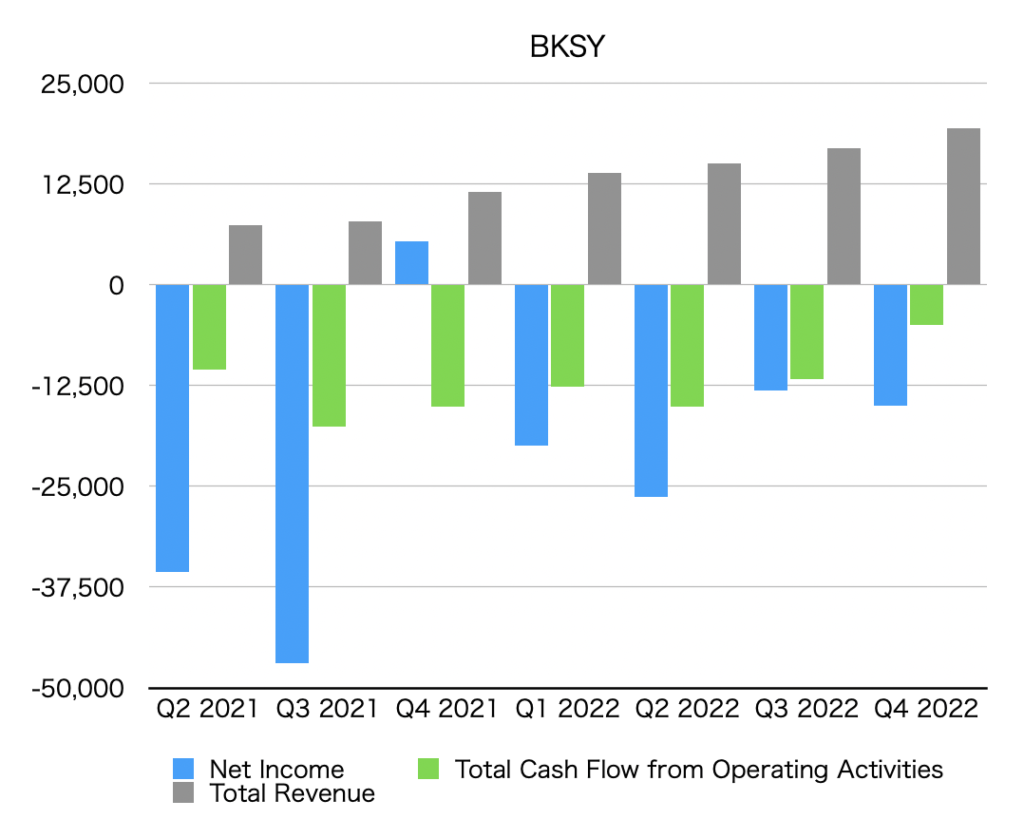
 Ottaka
Total revenue is trending steadily upward. We cannot confirm any such trend for net income and operating cash flow. (Sept. 03, 2022)
By year
Net income
Net Income is below.
Quarterly data
| Net Income [$1,000] | |
| Q2 2021 | -35,585 |
| Q3 2021 | -46,897 |
| Q4 2021 | 5,395 |
| Q1 2022 | -19,988 |
| Q2 2022 | -26,278 |
| Q3 2022 | -13,048 |
| Q4 2022 | -14,975 |
Annual data
| Net Income [$1,000] | |
| 2020 | -19,535 |
| 2021 | -245,643 |
| 2022 | -74,342 |
Operating cash flow
The Total Cash Flow from Operating Activities is as follows.
Quarterly data
| Total Cash Flow from Operating Activities [$1,000] | |
| Q2 2021 | -10,529 |
| Q3 2021 | -17,630 |
| Q4 2021 | -15,130 |
| Q1 2022 | -12,676 |
| Q2 2022 | -15,113 |
| Q3 2022 | -11,640 |
| Q4 2022 | -5,027 |
Annual data
| Total Cash Flow from Operating Activities [$1,000] | |
| 2020 | -31,674 |
| 2021 | -53,872 |
| 2022 | -44,456 |
Total revenue
Total revenue is below.
Quarterly data
| Total Revenue [$1,000] | Growth rate *YoY [%] | |
| Q2 2021 | 7,365 | |
| Q3 2021 | 7,937 | |
| Q4 2021 | 11,489 | |
| Q1 2022 | 13,896 | |
| Q2 2022 | 15,102 | +105 |
| Q3 2022 | 16,935 | +113 |
| Q4 2022 | 19,417 | +69 |
Annual data
| Total Revenue [$1,000] | Growth rate *YoY [%] | |
| 2020 | 21,135 | |
| 2021 | 34,085 | +61 |
| 2022 | 65,350 | +92 |
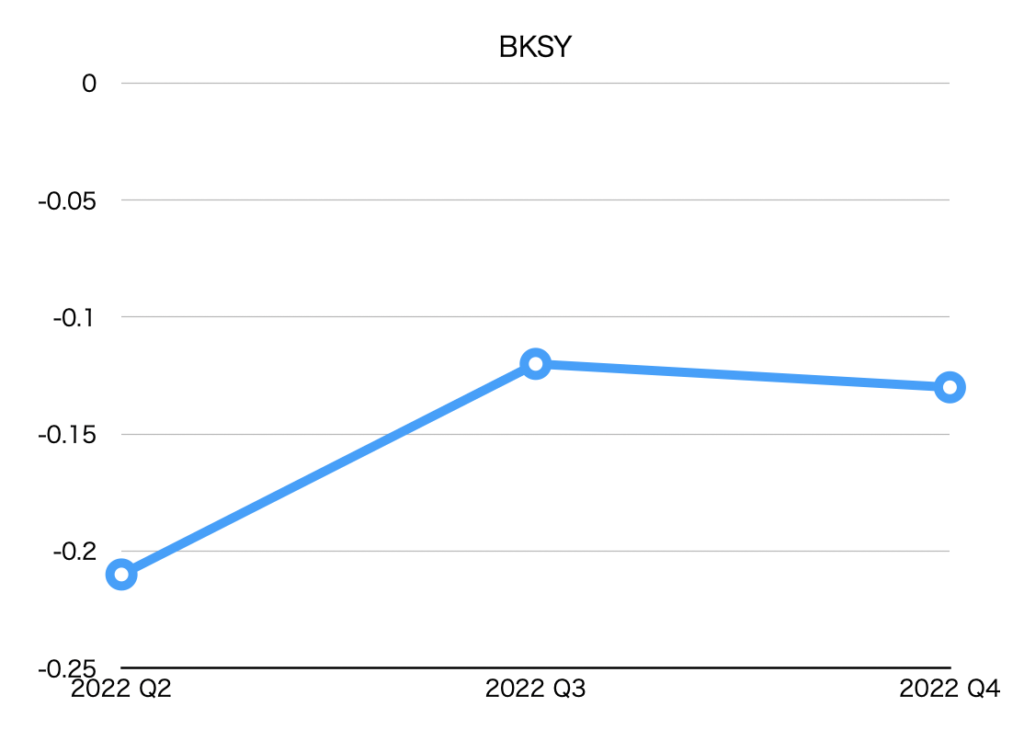
EPS (Net earnings per share)
| EPS [$] | |
| Q2 2022 | -0.21 |
| Q3 2022 | -0.11 |
| Q4 2022 | -0.13 |
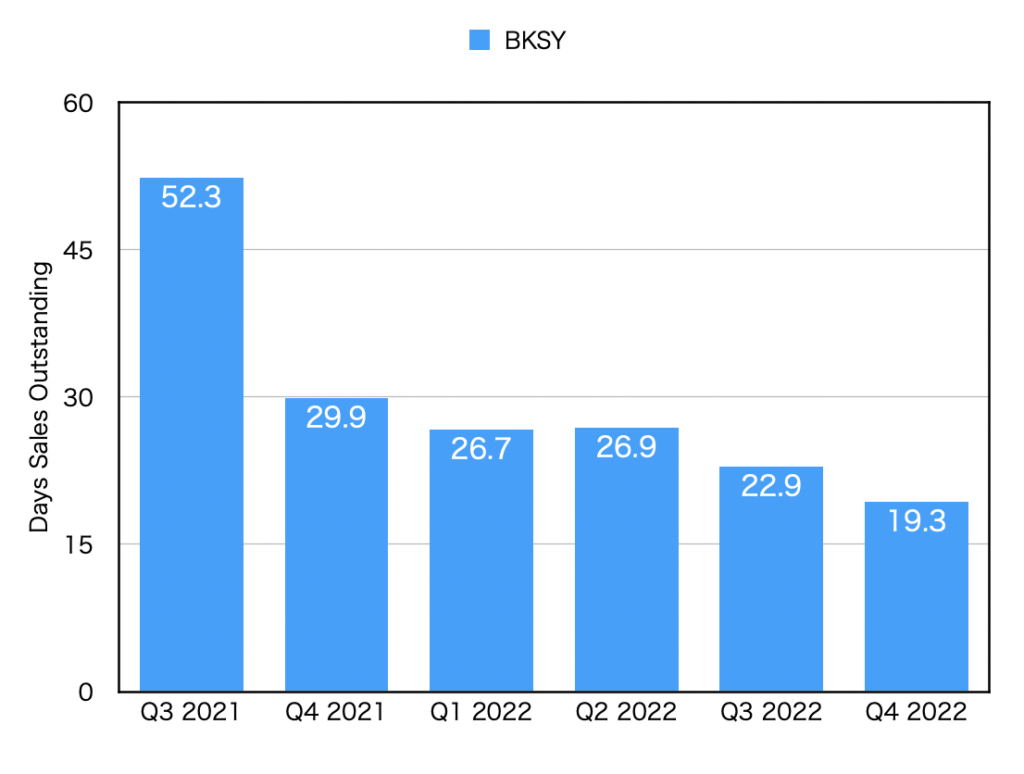
DSO(Days sales outstanding)
| DSO [day] | |
| Q3 2021 | 52.3 |
| Q4 2021 | 29.9 |
| Q1 2022 | 26.7 |
| Q2 2022 | 26.9 |
| Q3 2022 | 22.9 |
| Q4 2022 | 19.3 |
Revenue by region
The unit is $1,000.
| US | Middle East | Asia | Other | |
| Q1 2022 | 11,147 | 594 | 1,994 | 161 |
| Q2 2022 | 12,437 | 782 | 1,584 | 299 |
| Q3 2022 | 14,996 | 969 | 10 | 960 |
| Q4 2022 | 15,472 | 1,114 | 2,658 | 173 |
Revenue by customer attributes
The unit is $1,000.
| U.S. federal government and agencies | International government | Commercial and other | |
| Q1 2022 | 11,063 | 2,745 | 88 |
| Q2 2022 | 12,162 | 2,742 | 198 |
| Q3 2022 | 14,858 | 1,822 | 255 |
| Q4 2022 | 15,103 | 4,066 | 248 |
Revenue by each service
The unit is $1,000.
| Imagery | Data, software and analytics | Engineering & integration | |
| Q1 2022 | 3,610 | 6,162 | 4,124 |
| Q2 2022 | 6,833 | 6,517 | 1,752 |
| Q3 2022 | 10,769 | 4,222 | 1,944 |
| Imagery | Data, software and analytics | Engineering services | Professional services | |
| 2021 | 8,648 | 6,717 | 9,039 | 9,681 |
| 2022 | 34,242 | 13,173 | 9,372 | 8,563 |
OttakaI am keeping a close eye on how much data, software, and analytics will grow in the future.