TOC
Introduction
The financial results of Coinbase Global, Inc is summarized in this page.
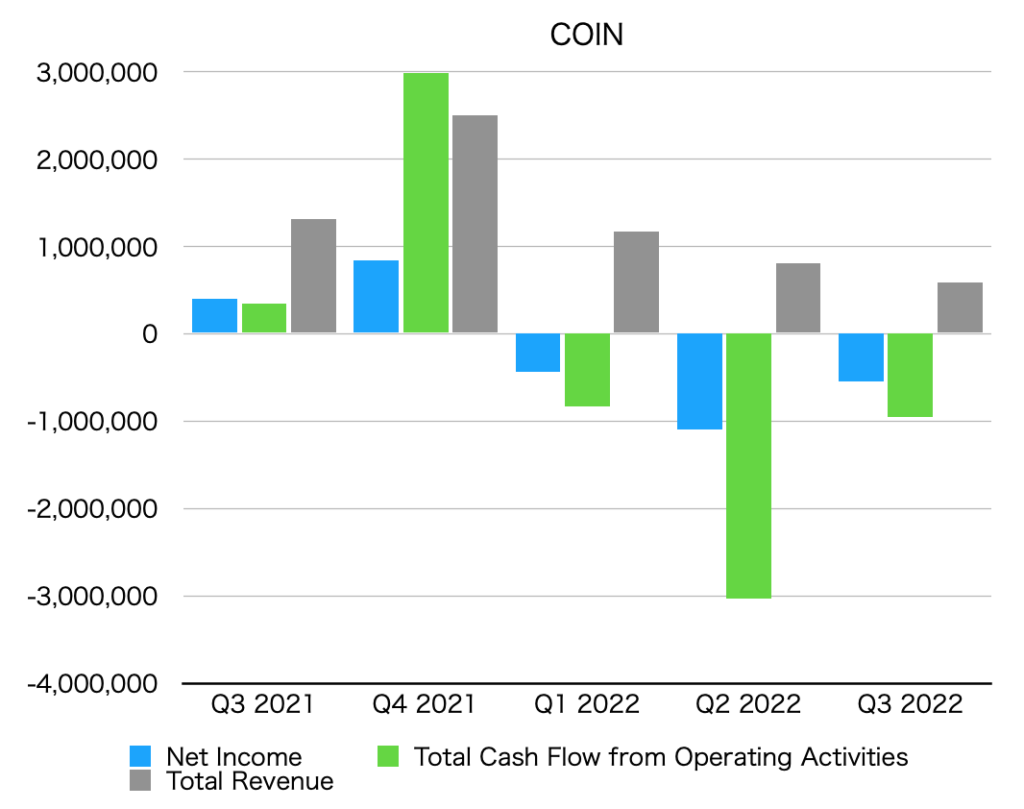
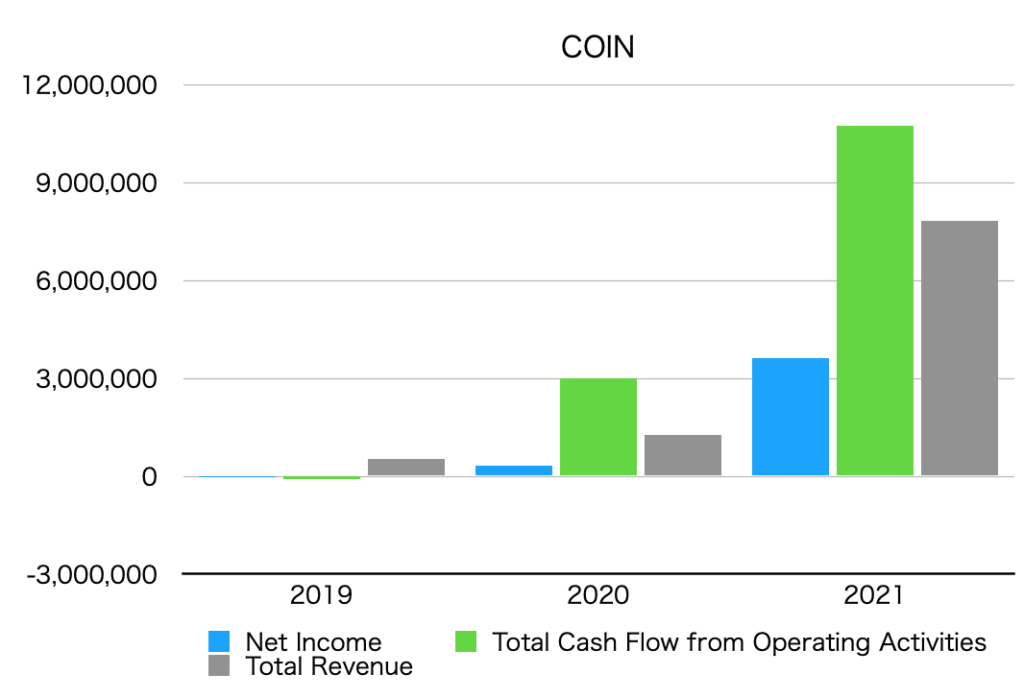
Summary of net income, operating cash flow, and total revenue (graph)
The unit is $1,000.
By quarter

By year
Net income
Net Income is below.
Quarterly data
| Net Income [$1,000] |
| Q3 2021 | 406,100 |
| Q4 2021 | 840,208 |
| Q1 2022 | -429,659 |
| Q2 2022 | -1,093,654 |
| Q3 2022 | -544,635 |
Annual data
| Net Income [$1,000] |
| 2019 | -30,387 |
| 2020 | 322,317 |
| 2021 | 3,624,120 |
Operating cash flow
Total Cash Flow from Operating Activities is as follows.
Quarterly data
| Total Cash Flow from Operating Activities [$1,000] |
| Q3 2021 | 342,047 |
| Q4 2021 | 2,993,320 |
| Q1 2022 | -830,114 |
| Q2 2022 | -3,033,661 |
| Q3 2022 | -953,501 |
Annual data
| Total Cash Flow from Operating Activities [$1,000] |
| 2019 | -80,594 |
| 2020 | 3,004,070 |
| 2021 | 10,730,031 |
Total revenue
Total revenue is below.
Quarterly data
| Total Revenue [$1,000] |
| Q3 2021 | 1,311,908 |
| Q4 2021 | 2,498,463 |
| Q1 2021 | 1,166,436 |
| Q2 2022 | 808,325 |
| Q3 2022 | 590,339 |
Annual data
| Total Revenue [$1,000] |
| 2019 | 533,735 |
| 2020 | 1,277,481 |
| 2021 | 7,839,444 |
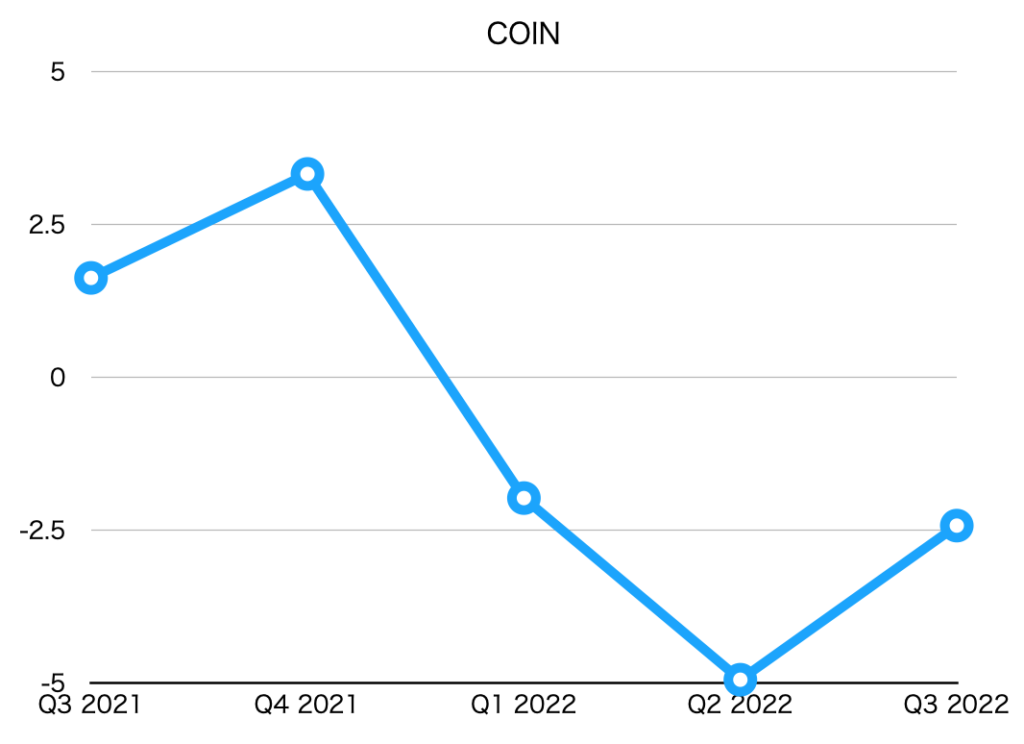
EPS (Net earnings per share)
| EPS [$] |
| Q3 2021 | 1.62 |
| Q4 2021 | 3.32 |
| Q1 2022 | -1.98 |
| Q2 2022 | -4.95 |
| Q3 2022 | -2.43 |
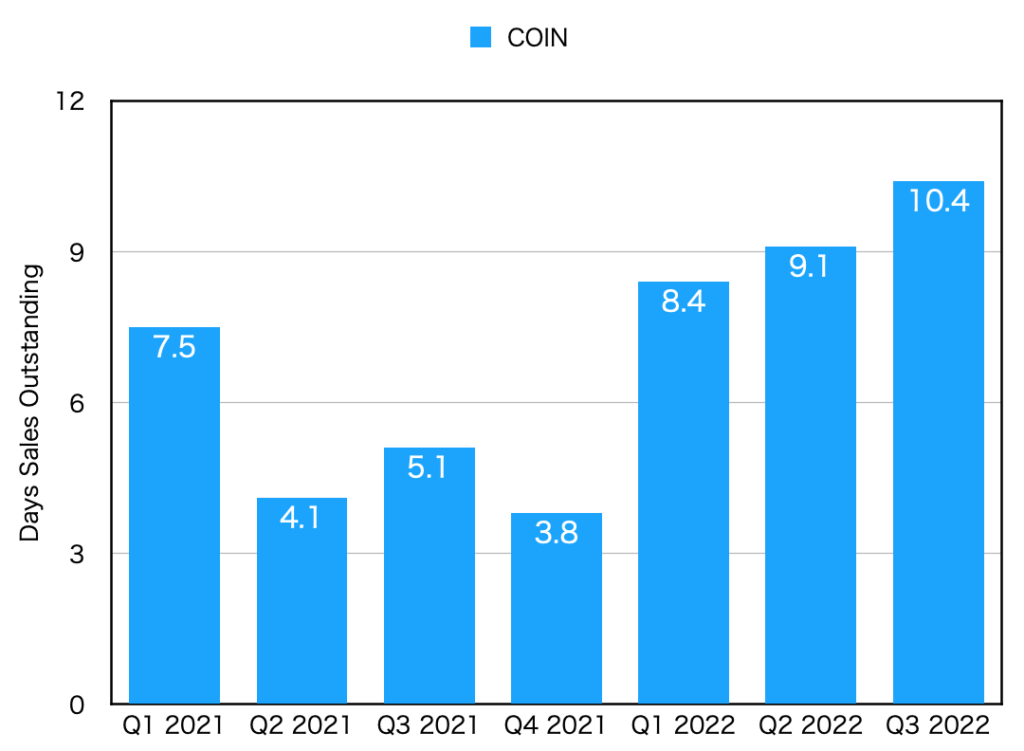
DSO(Days sales outstanding)
| DSO [day] |
| Q1 2021 | 7.5 |
| Q2 2021 | 4.1 |
| Q3 2021 | 5.1 |
| Q4 2021 | 3.8 |
| Q1 2022 | 8.4 |
| Q2 2022 | 9.1 |
| Q3 2022 | 10.4 |