Introduction
The financial results of Samsara Inc is summarized in this page.
Company profile
Samsara is a technology company that provides Internet of Things (IoT) solutions for fleet management, industrial monitoring, and safety compliance. The company’s hardware and software products include vehicle telematics, asset tracking sensors, environmental sensors, and safety cameras, providing real-time data and insights to help businesses improve their operations and efficiency.
Samsara’s fleet management solutions enable businesses to track their vehicles and drivers in real-time, optimize routing and fuel consumption, monitor driver behavior, and improve safety compliance. The company’s industrial monitoring solutions provide insights into machine performance, energy consumption, and other critical metrics to help businesses optimize their operations and reduce downtime. Samsara’s safety solutions allow companies to comply with safety regulations and monitor safety incidents, providing insights to improve safety culture and reduce accidents.
Samsara serves customers in various industries, including transportation, construction, energy, and manufacturing. Its technology is designed to help businesses improve their operations, reduce costs, and increase safety and compliance.
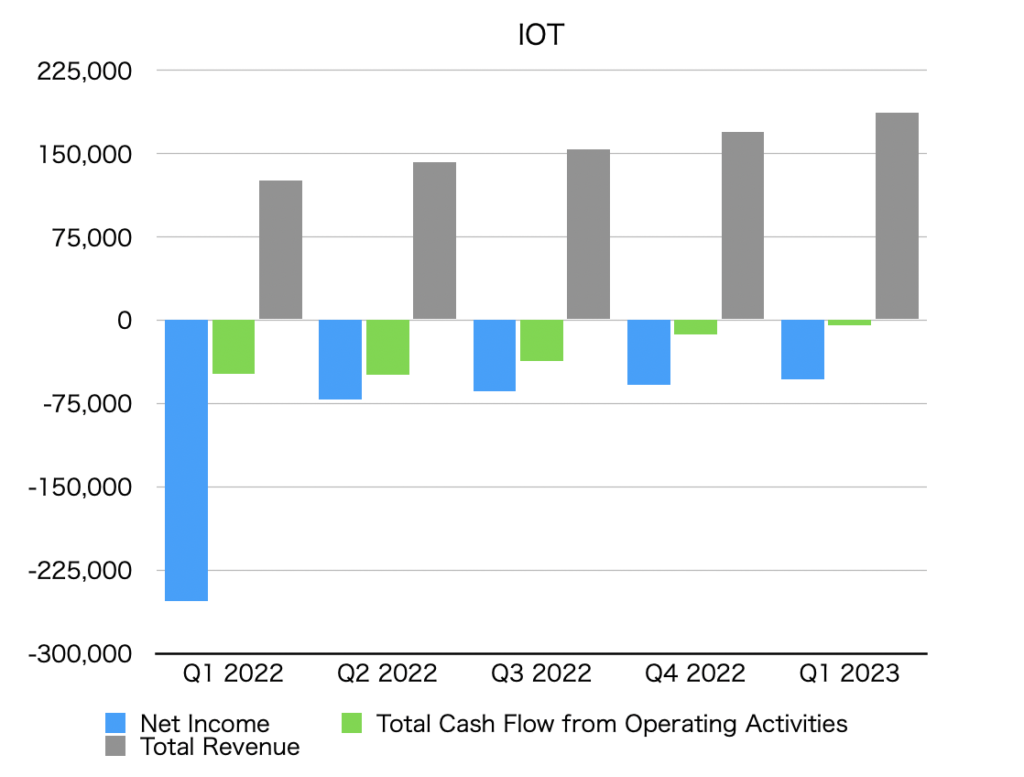
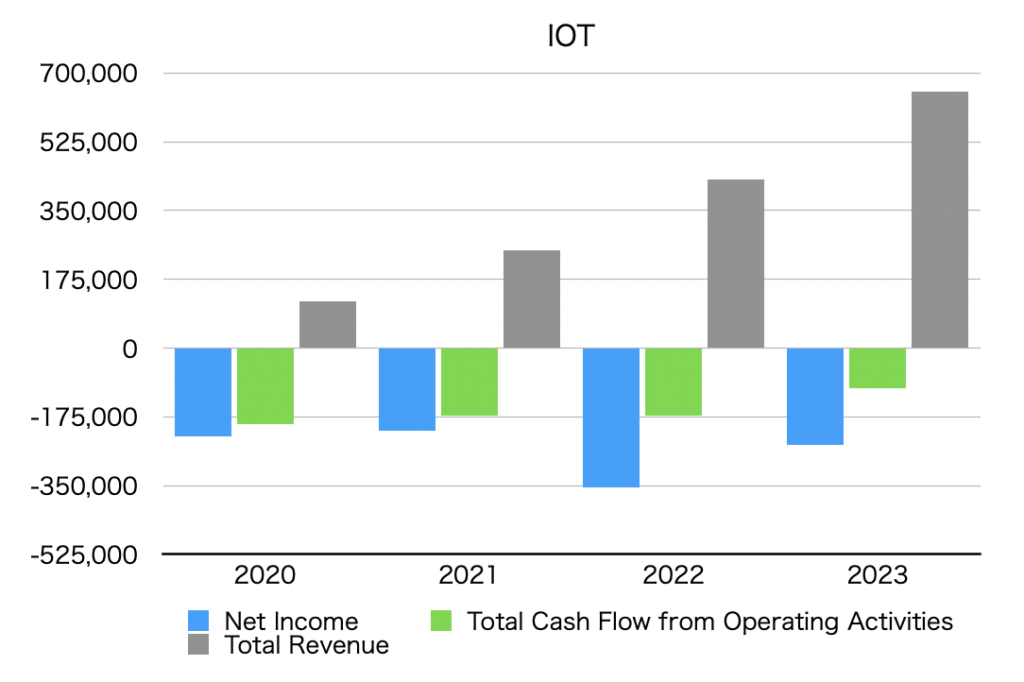
Summary of net income, operating cash flow, and total revenue (graph)
The unit is $1,000.
By quarter

By year

Net income
Net Income is below.
Quarterly data
| Net Income [$1,000] | |
| Q1 2022 | -252,767 |
| Q2 2022 | -70,988 |
| Q3 2022 | -64,281 |
| Q4 2022 | -58,555 |
| Q1 2023 | -53,598 |
Annual data
| Net Income [$1,000] | |
| 2020 | -225,224 |
| 2021 | -210,208 |
| 2022 | -355,024 |
| 2023 | -247,422 |
Operating cash flow
Total Cash Flow from Operating Activities is as follows.
Quarterly data
| Total Cash Flow from Operating Activities [$1,000] | |
| Q1 2022 | -48,305 |
| Q2 2022 | -48,782 |
| Q3 2022 | -36,978 |
| Q4 2022 | -12,888 |
| Q1 2023 | -4,373 |
Annual data
| Total Cash Flow from Operating Activities [$1,000] | |
| 2020 | -192,525 |
| 2021 | -171,769 |
| 2022 | -171,481 |
| 2023 | -103,021 |
Total revenue
Total revenue is below.
Quarterly data
| Total Revenue [$1,000] | |
| Q1 2021 | 125,752 |
| Q2 2022 | 142,645 |
| Q3 2022 | 153,523 |
| Q4 2022 | 169,800 |
| Q1 2023 | 186,577 |
Annual data
| Total Revenue [$1,000] | |
| 2020 | 119,865 |
| 2021 | 249,905 |
| 2022 | 428,345 |
| 2023 | 652,545 |
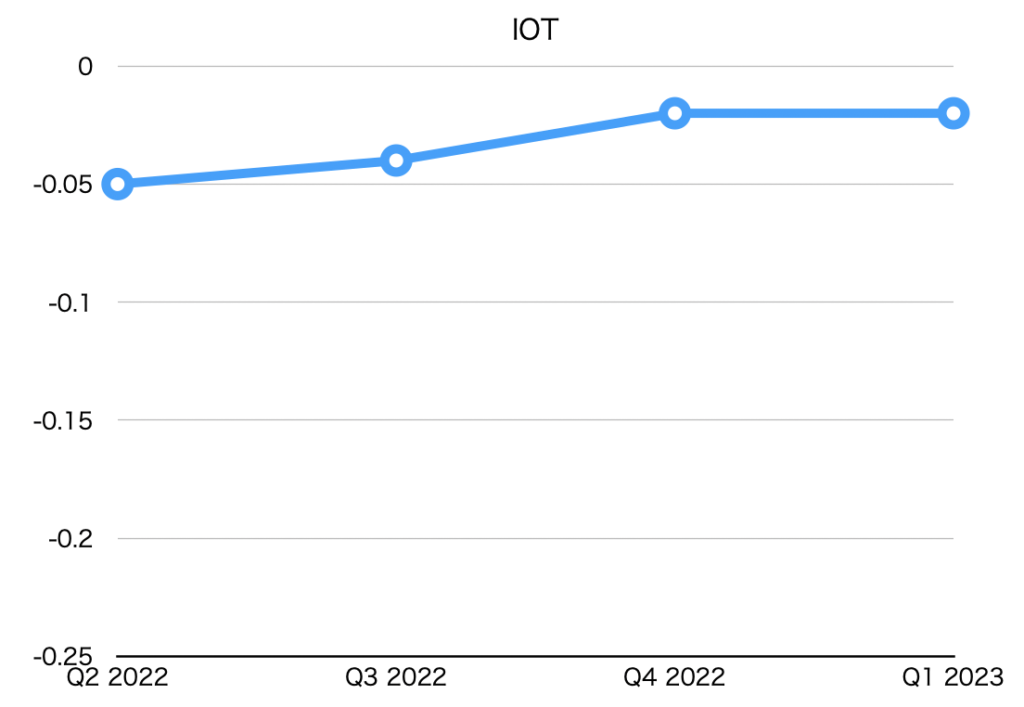
EPS (Net earnings per share)
| EPS [$] | |
| Q2 2022 | -0.05 |
| Q3 2022 | -0.04 |
| Q4 2022 | -0.02 |
| Q1 2023 | -0.02 |

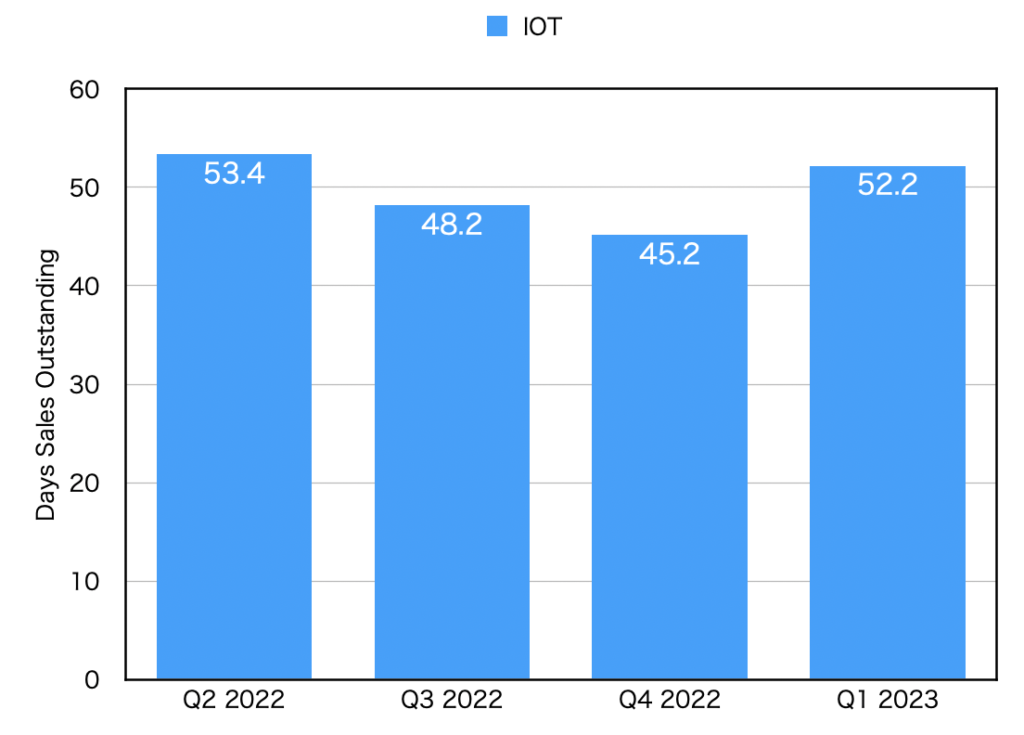
DSO(Days sales outstanding)
| DSO [day] | |
| Q2 2022 | 53.4 |
| Q3 2022 | 48.2 |
| Q4 2022 | 45.2 |
| Q1 2023 | 52.2 |


