TOC
Introduction
The financial results of Lucid Group, Inc. are summarized on this page.
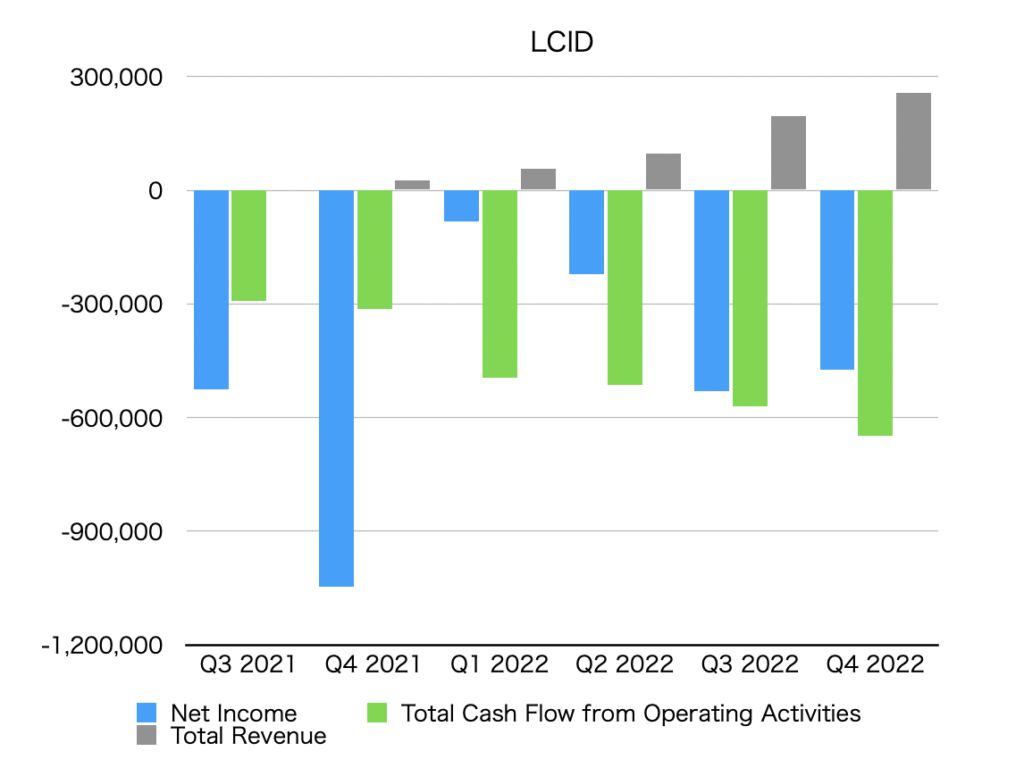
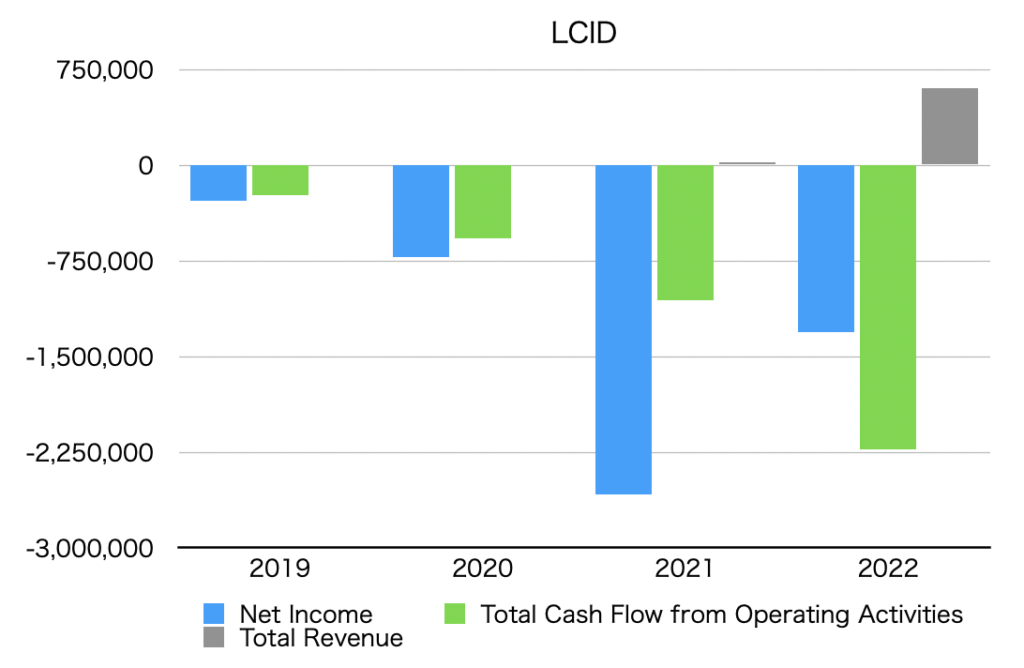
Summary of net income, operating cash flow, and total revenue (graph)
The unit is $1,000.
By quarter

By year
Net income
Net Income is below.
Quarterly data
| Net Income [$1,000] |
| Q3 2021 | -524,403 |
| Q4 2021 | -1,045,680 |
| Q1 2022 | -81,286 |
| Q2 2022 | -220,425 |
| Q3 2022 | -530,101 |
| Q4 2022 | -472,648 |
Annual data
| Net Income [$1,000] |
| 2019 | -277,357 |
| 2020 | -719,380 |
| 2021 | -2,579,761 |
| 2022 | -1,304,460 |
Operating cash flow
Total Cash Flow from Operating Activities is as follows.
Quarterly data
| Total Cash Flow from Operating Activities [$1,000] |
| Q3 2021 | -291,597 |
| Q4 2021 | -312,732 |
| Q1 2022 | -494,649 |
| Q2 2022 | -513,628 |
| Q3 2022 | -569,466 |
| Q4 2022 | -648,515 |
Annual data
| Total Cash Flow from Operating Activities [$1,000] |
| 2019 | -235,299 |
| 2020 | -570,196 |
| 2021 | -1,058,133 |
| 2022 | -2,226,258 |
Total revenue
Total revenue is below.
Quarterly data
| Total Revenue [$1,000] |
| Q3 2021 | 232 |
| Q4 2021 | 26,392 |
| Q1 2022 | 57,675 |
| Q2 2022 | 97,336 |
| Q3 2022 | 195,457 |
| Q4 2022 | 257,713 |
Annual data
| Total Revenue [$1,000] |
| 2019 | 4,590 |
| 2020 | 3,976 |
| 2021 | 27,111 |
| 2022 | 608,181 |
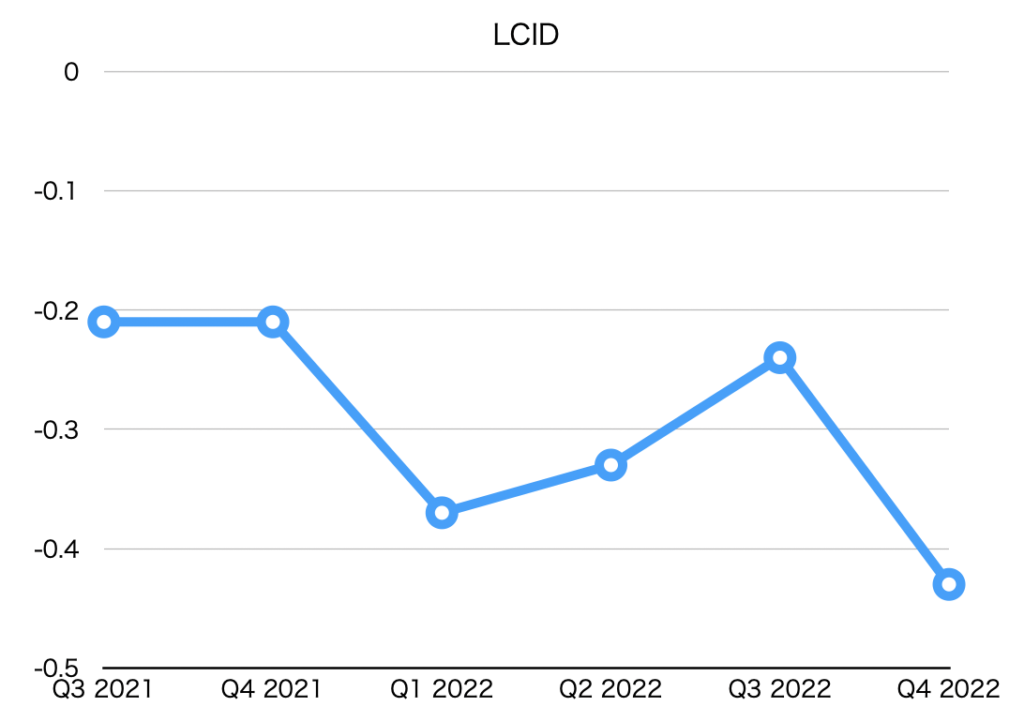
EPS (Net earnings per share)
| EPS [$] |
| Q3 2021 | -0.21 |
| Q4 2021 | -0.21 |
| Q1 2022 | -0.37 |
| Q2 2022 | -0.33 |
| Q3 2022 | -0.24 |
| Q4 2022 | -0.43 |
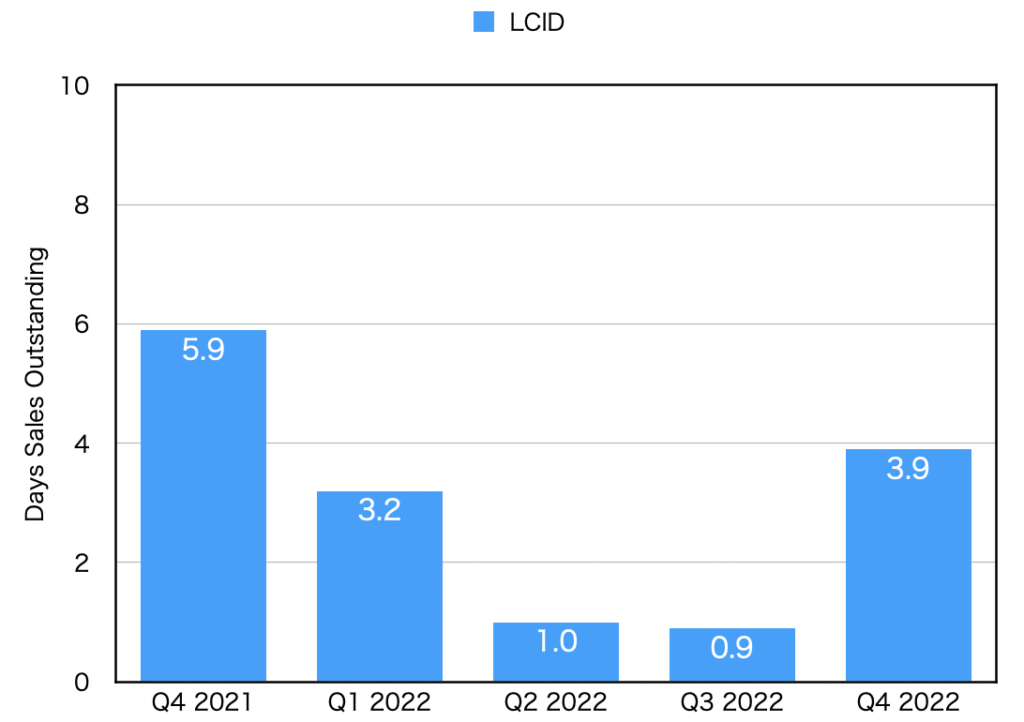
DSO(Days sales outstanding)
| DSO [day] |
| Q4 2021 | 5.9 |
| Q1 2022 | 3.2 |
| Q2 2022 | 1.0 |
| Q3 2022 | 0.9 |
| Q4 2022 | 3.9 |