[U.S. Stocks] Palantir Technologies Inc (PLTR) Earnings Summary
広告・PR
TOC
Introduction
The financial results of Palantir Technologies Inc is summarized in this page.
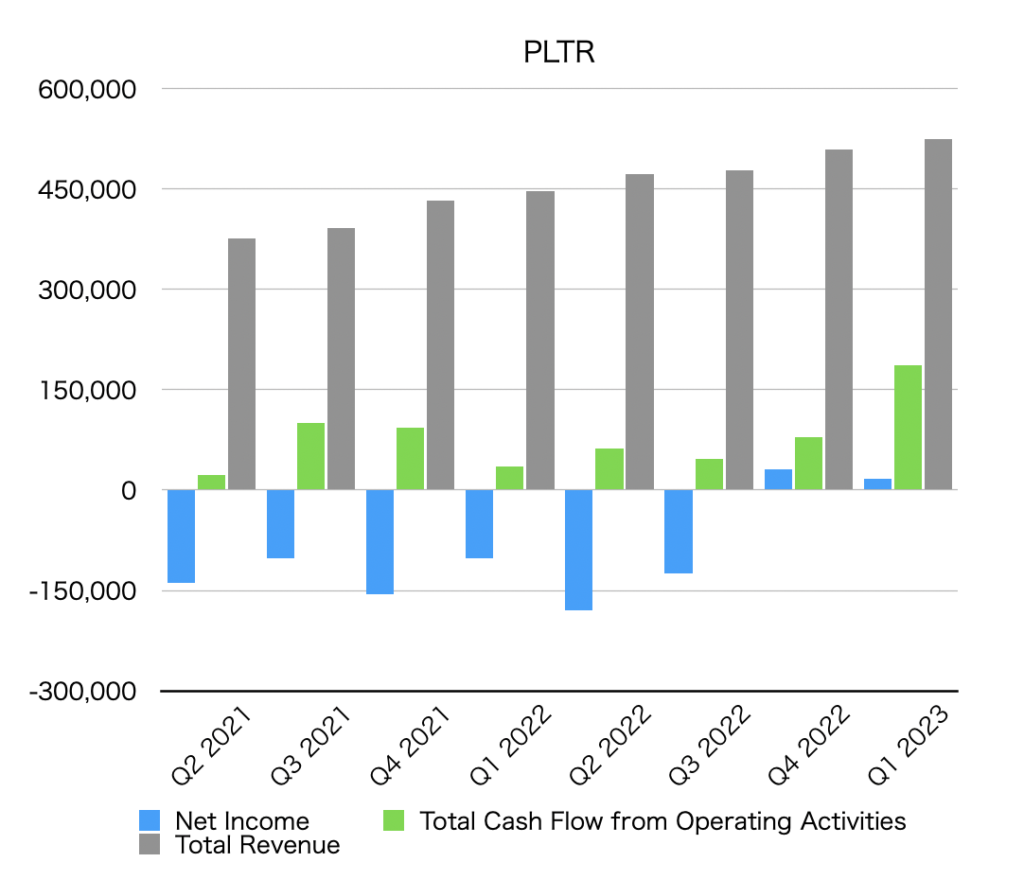
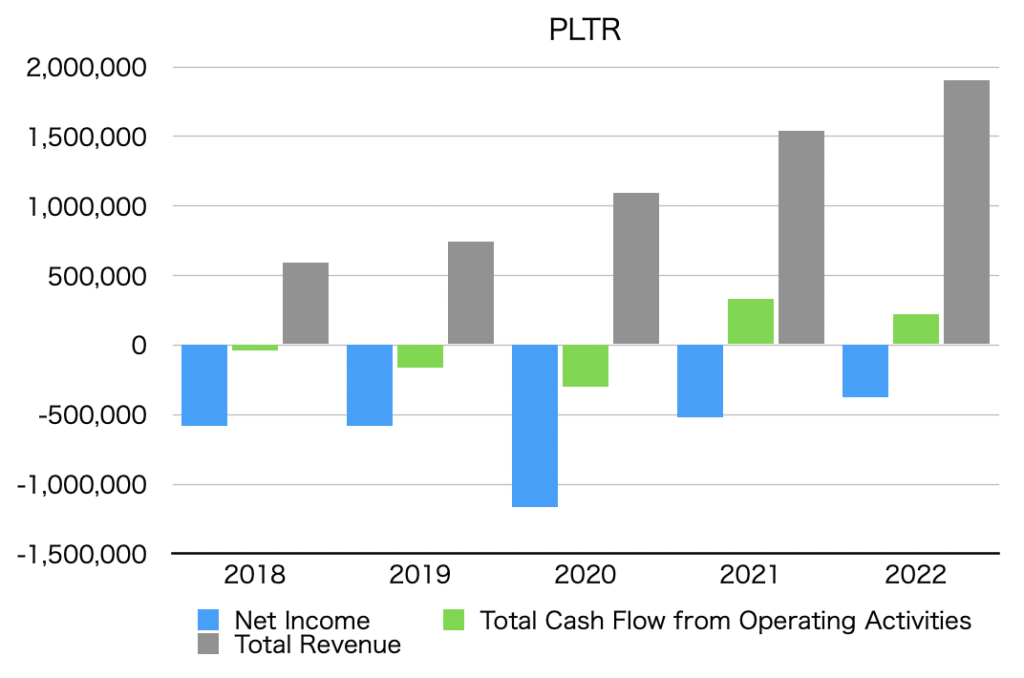
Summary of net income, operating cash flow, and total revenue (graph)
The unit is $1,000.
By quarter

By year
Net income
Net Income is below.
Quarterly data
| Net Income [$1,000] |
| Q2 2021 | -138,580 |
| Q3 2021 | -102,137 |
| Q4 2021 | -156,188 |
| Q1 2022 | -101,379 |
| Q2 2022 | -179,329 |
| Q3 2022 | -123,875 |
| Q4 2022 | 30,878 |
| Q1 2023 | 16,802 |
In Q4 2022, net income became positive.
(noted on 2023.Feb.22th)
Annual data
| Net Income [$1,000] |
| 2018 | -580,027 |
| 2019 | -579,646 |
| 2020 | -1,166,391 |
| 2021 | -520,379 |
| 2022 | -373,705 |
Operating cash flow
Total Cash Flow from Operating Activities is as follows.
Quarterly data
| Total Cash Flow from Operating Activities [$1,000] |
| Q2 2021 | 22,750 |
| Q3 2021 | 100,793 |
| Q4 2021 | 93,427 |
| Q1 2022 | 35,477 |
| Q2 2022 | 62,431 |
| Q3 2022 | 47,066 |
| Q4 2022 | 78,763 |
| Q1 2023 | 187,376 |
Annual data
| Total Cash Flow from Operating Activities [$1,000] |
| 2018 | -39,012 |
| 2019 | -165,215 |
| 2020 | -296,608 |
| 2021 | 333,851 |
| 2022 | 223,737 |
Total revenue
Total revenue is below.
Quarterly data
| Total Revenue [$1,000] |
| Q2 2021 | 375,642 |
| Q3 2021 | 392,146 |
| Q4 2021 | 432,867 |
| Q1 2021 | 446,357 |
| Q2 2022 | 473,010 |
| Q3 2022 | 477,880 |
| Q4 2022 | 508,624 |
| Q1 2023 | 525,186 |
Annual data
| Total Revenue [$1,000] |
| 2018 | 595,409 |
| 2019 | 742,555 |
| 2020 | 1,092,673 |
| 2021 | 1,541,889 |
| 2022 | 1,905,871 |
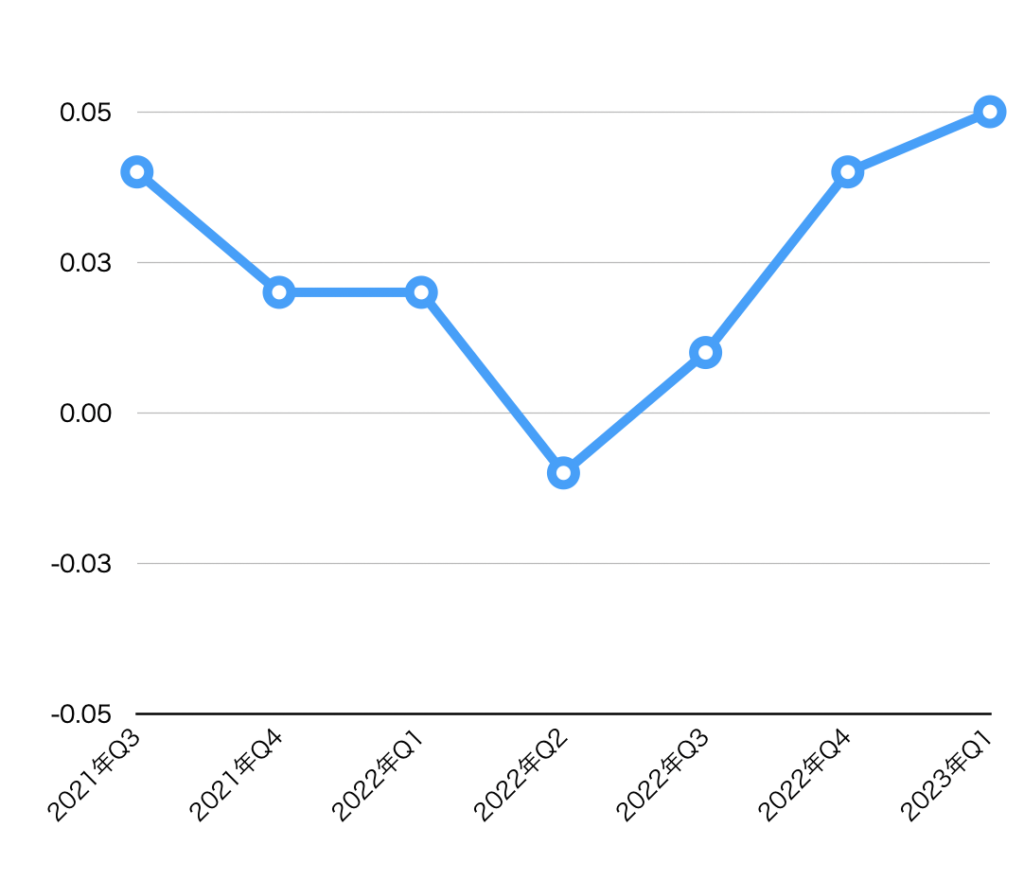
EPS (Net earnings per share)
| EPS [$] |
| Q3 2021 | 0.04 |
| Q4 2021 | 0.02 |
| Q1 2022 | 0.02 |
| Q2 2022 | -0.01 |
| Q3 2022 | 0.01 |
| Q4 2022 | 0.04 |
| Q1 2023 | 0.05 |
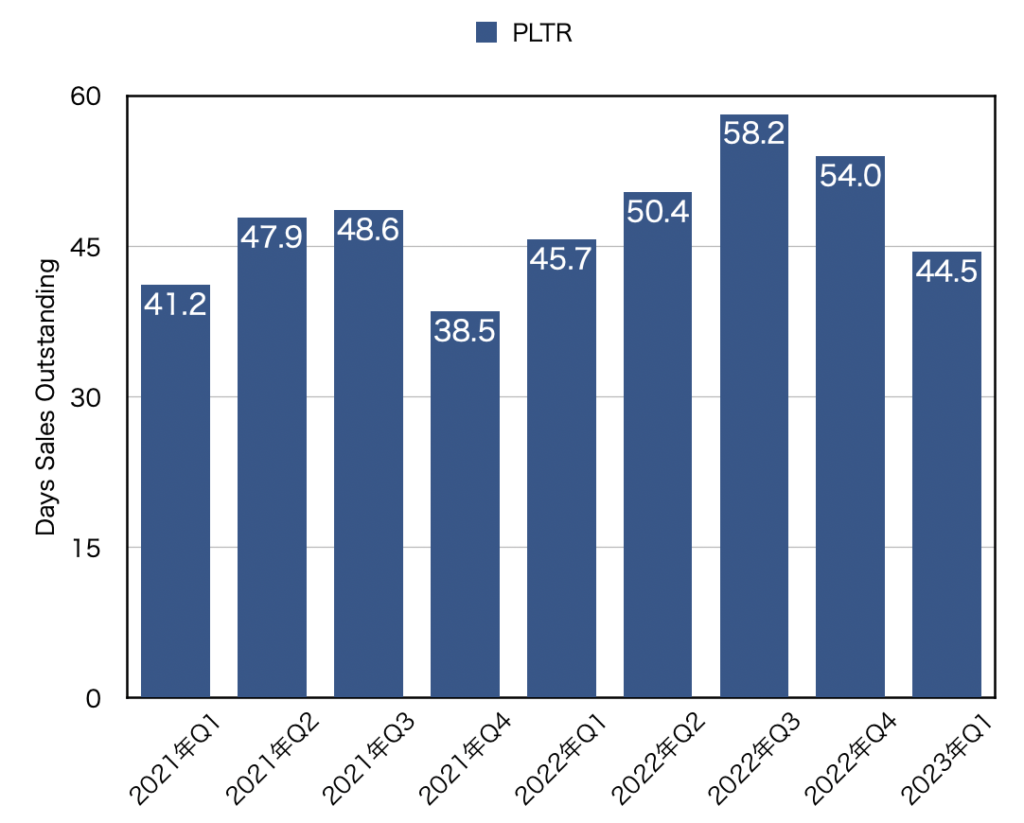
DSO(Days sales outstanding)
| DSO [day] |
| Q2 2021 | 47.9 |
| Q3 2021 | 48.6 |
| Q4 2021 | 38.5 |
| Q1 2022 | 45.7 |
| Q2 2022 | 50.4 |
| Q3 2022 | 58.2 |
| Q4 2022 | 54.0 |
| Q1 2023 | 44.5 |
Author of this article
Hello. I write about investments, travel, and more. We look forward to helping you even a little.
 Ottaka