TOC
Introduction
The financial results of Rocket Lab USA, Inc. is summarized in this page.
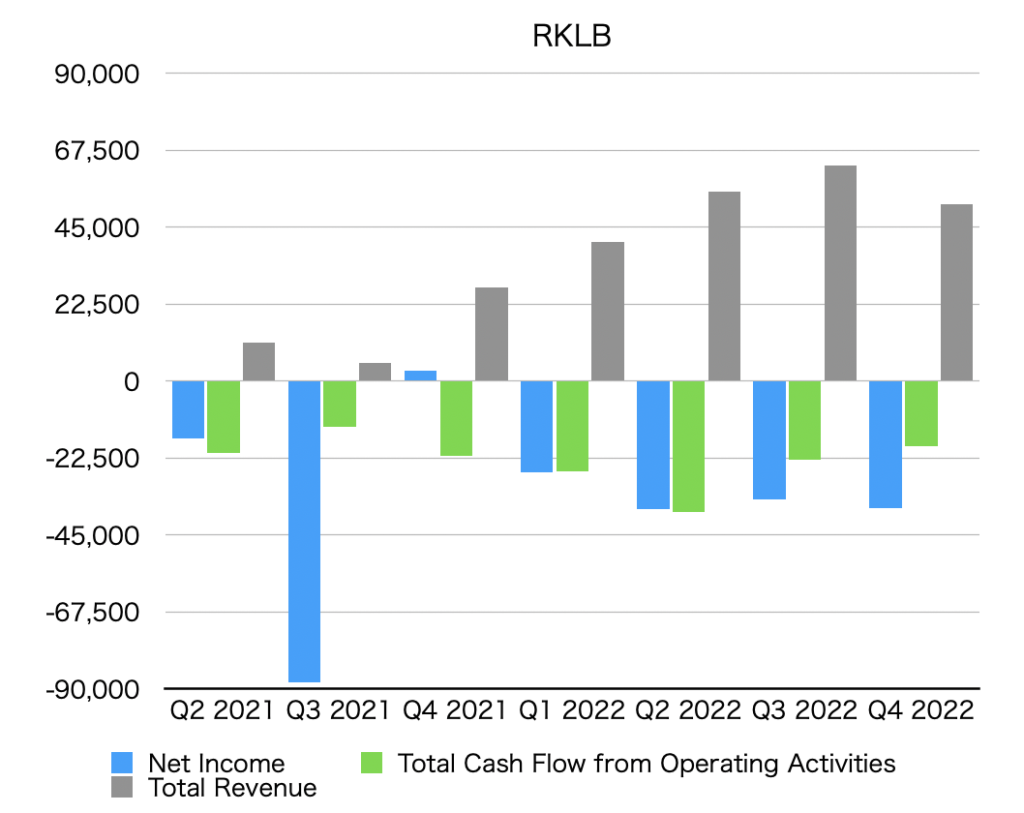
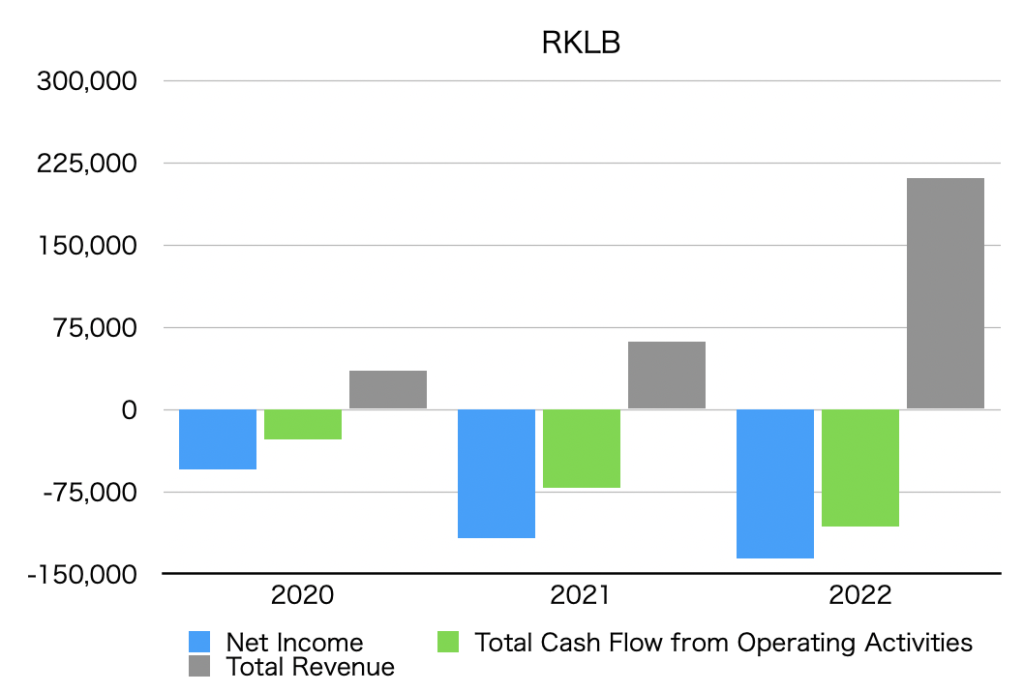
Summary of net income, operating cash flow, and total revenue (graph)
The unit is $1,000.
By quarter

By year

Net income
Net Income is below.
Quarterly data
| Net Income [$1,000] |
| Q2 2021 | -16,665 |
| Q3 2021 | -87,969 |
| Q4 2021 | 3,196 |
| Q1 2022 | -26,709 |
| Q2 2022 | -37,417 |
| Q3 2022 | -34,610 |
| Q4 2022 | -37,208 |
Annual data
| Net Income [$1,000] |
| 2020 | -55,005 |
| 2021 | -117,320 |
| 2022 | -135,944 |
Operating cash flow
Total Cash Flow from Operating Activities is as follows.
Quarterly data
| Total Cash Flow from Operating Activities [$1,000] |
| Q2 2021 | -21,103 |
| Q3 2021 | -13,295 |
| Q4 2021 | -21,914 |
| Q1 2022 | -26,339 |
| Q2 2022 | -38,256 |
| Q3 2022 | -22,997 |
| Q4 2022 | -18,946 |
Annual data
| Total Cash Flow from Operating Activities [$1,000] |
| 2020 | -27,757 |
| 2021 | -71,791 |
| 2022 | -106,538 |
Total revenue
Total revenue is below.
Quarterly data
| Total Revenue [$1,000] | Growth rate *YoY [%] |
| Q2 2021 | 11,280 | |
| Q3 2021 | 5,287 | |
| Q4 2021 | 27,478 | |
| Q1 2022 | 40,703 | |
| Q2 2022 | 55,474 | +392 |
| Q3 2022 | 63,057 | +1093 |
| Q4 2022 | 51,762 | +88 |
Annual data
| Total Revenue [$1,000] | Growth rate *YoY [%] |
| 2020 | 35,160 | |
| 2021 | 62,237 | +77 |
| 2022 | 210,996 | +239 |
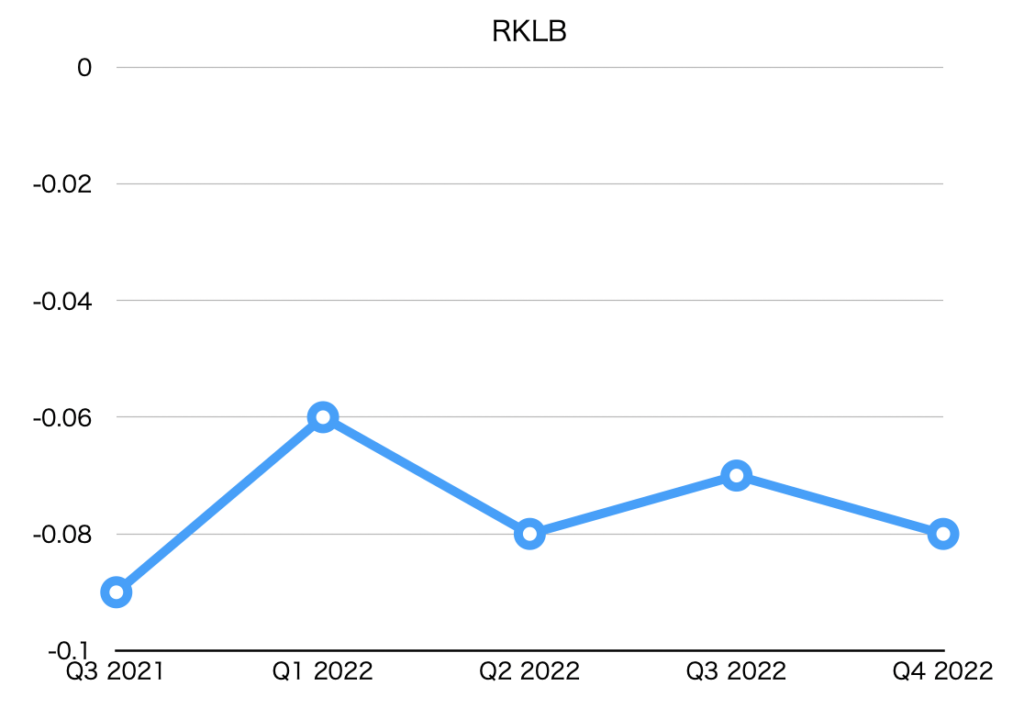
EPS (Net earnings per share)
| EPS [$] |
| Q3 2021 | -0.09 |
| Q1 2022 | -0.06 |
| Q2 2022 | -0.08 |
| Q3 2022 | -0.07 |
| Q4 2022 | -0.08 |

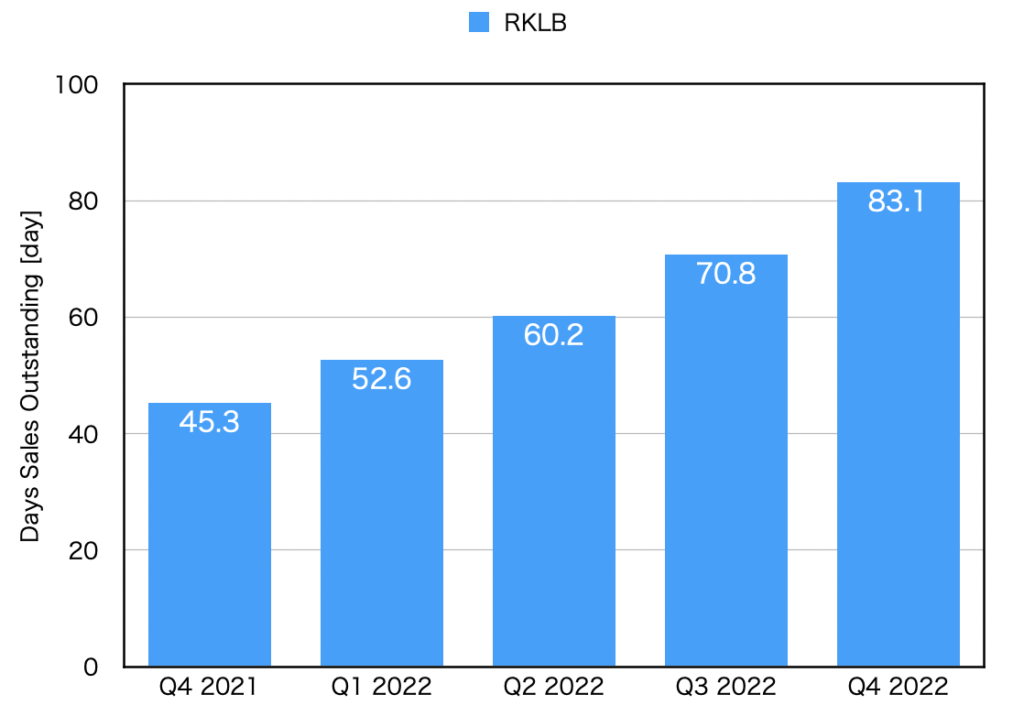
DSO(Days sales outstanding)
| DSO [day] |
| Q4 2021 | 45.3 |
| Q1 2022 | 52.6 |
| Q2 2022 | 60.2 |
| Q3 2022 | 70.8 |
| Q4 2022 | 83.1 |


