TOC
Introduction
The financial results of Snowflake Inc is summarized in this page.
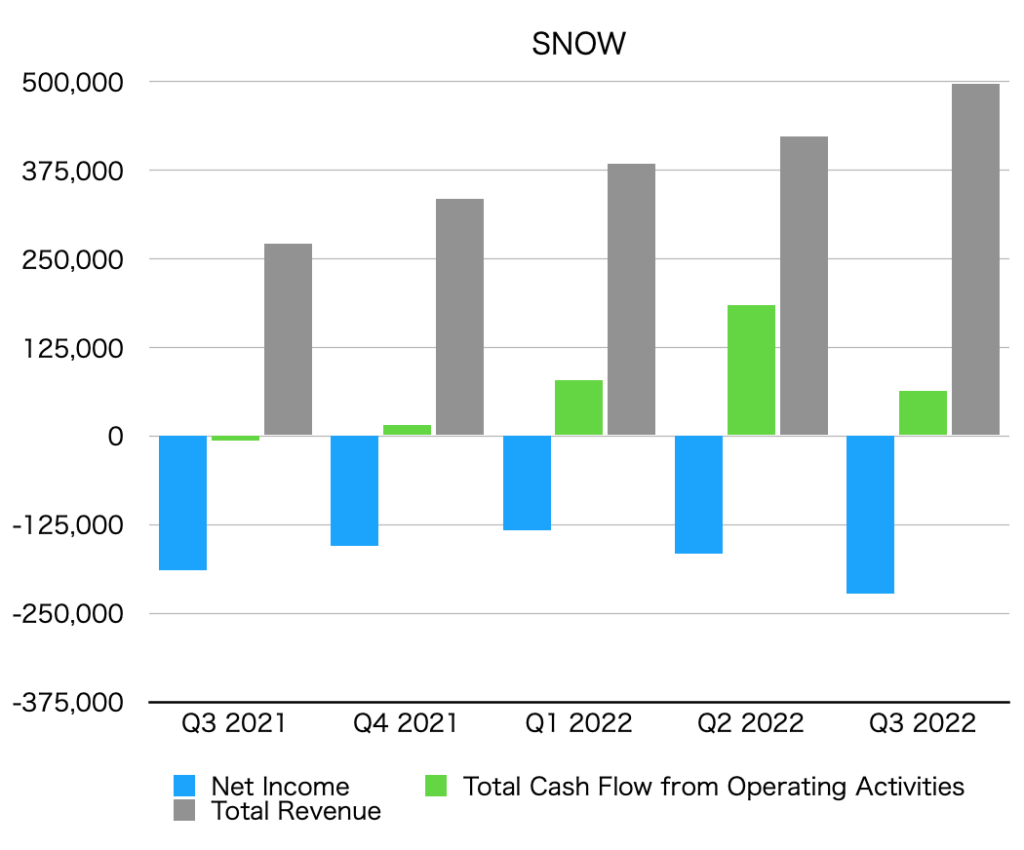
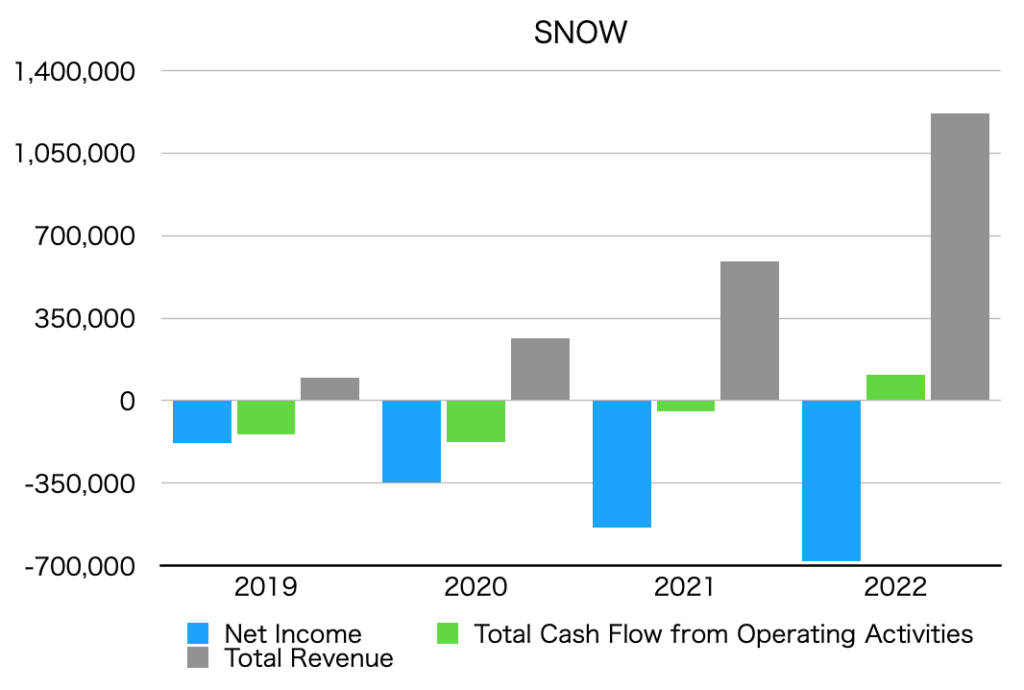
Summary of net income, operating cash flow, and total revenue (graph)
The unit is $1,000.
By quarter

By year

Net income
Net Income is below.
Quarterly data
| Net Income [$1,000] |
| Q3 2021 | -189,719 |
| Q4 2021 | -154,856 |
| Q1 2022 | -132,153 |
| Q2 2022 | -165,794 |
| Q3 2022 | -222,806 |
Annual data
| Net Income [$1,000] |
| 2019 | -178,028 |
| 2020 | -348,535 |
| 2021 | -539,102 |
| 2022 | -679,948 |
Operating cash flow
Total Cash Flow from Operating Activities is as follows.
Quarterly data
| Total Cash Flow from Operating Activities [$1,000] |
| Q3 2021 | -6,111 |
| Q4 2021 | 15,538 |
| Q1 2022 | 78,898 |
| Q2 2022 | 184,613 |
| Q3 2022 | 64,433 |
Annual data
| Total Cash Flow from Operating Activities [$1,000] |
| 2019 | -143,982 |
| 2020 | -176,558 |
| 2021 | -45,417 |
| 2022 | 110,179 |
Total revenue
Total revenue is below.
Quarterly data
| Total Revenue [$1,000] |
| Q3 2021 | 272,198 |
| Q4 2021 | 334,441 |
| Q1 2021 | 383,774 |
| Q2 2022 | 422,371 |
| Q3 2022 | 497,248 |
Annual data
| Total Revenue [$1,000] |
| 2019 | 96,666 |
| 2020 | 264,748 |
| 2021 | 592,049 |
| 2022 | 1,219,327 |
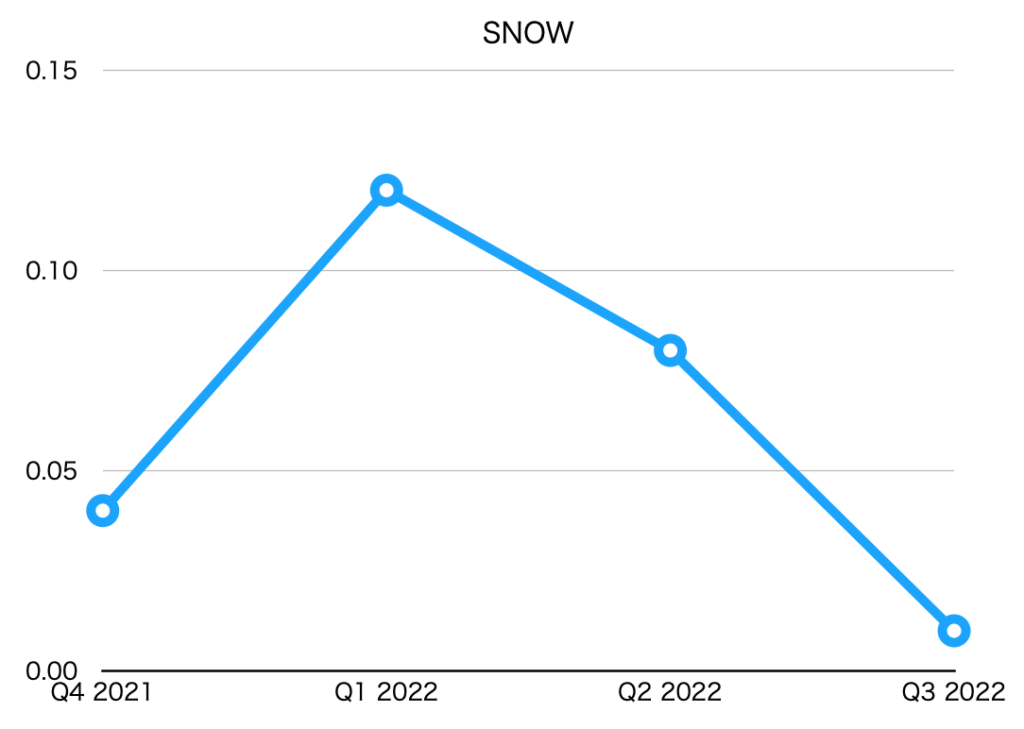
EPS (Net earnings per share)
| EPS [$] |
| Q4 2021 | 0.04 |
| Q1 2022 | 0.12 |
| Q2 2022 | 0.08 |
| Q3 2022 | 0.01 |

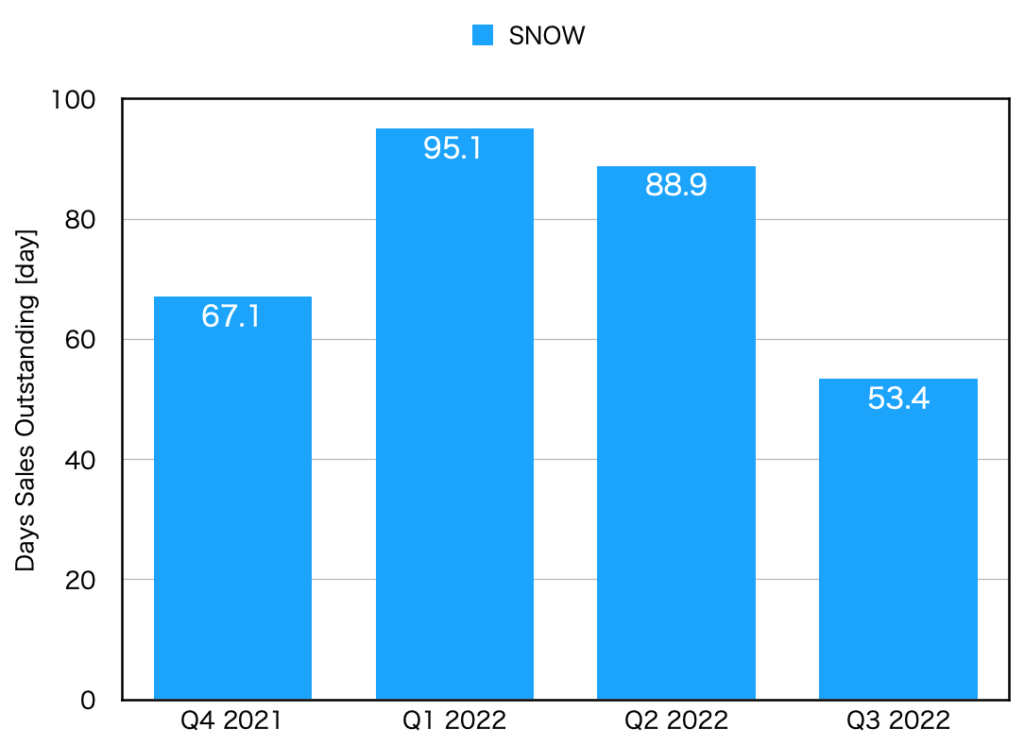
DSO(Days sales outstanding)
| DSO [day] |
| Q4 2021 | 67.1 |
| Q1 2022 | 95.1 |
| Q2 2022 | 88.9 |
| Q3 2022 | 53.4 |


