TOC
Introduction
The financial results of Viasat, Inc is summarized in this page.
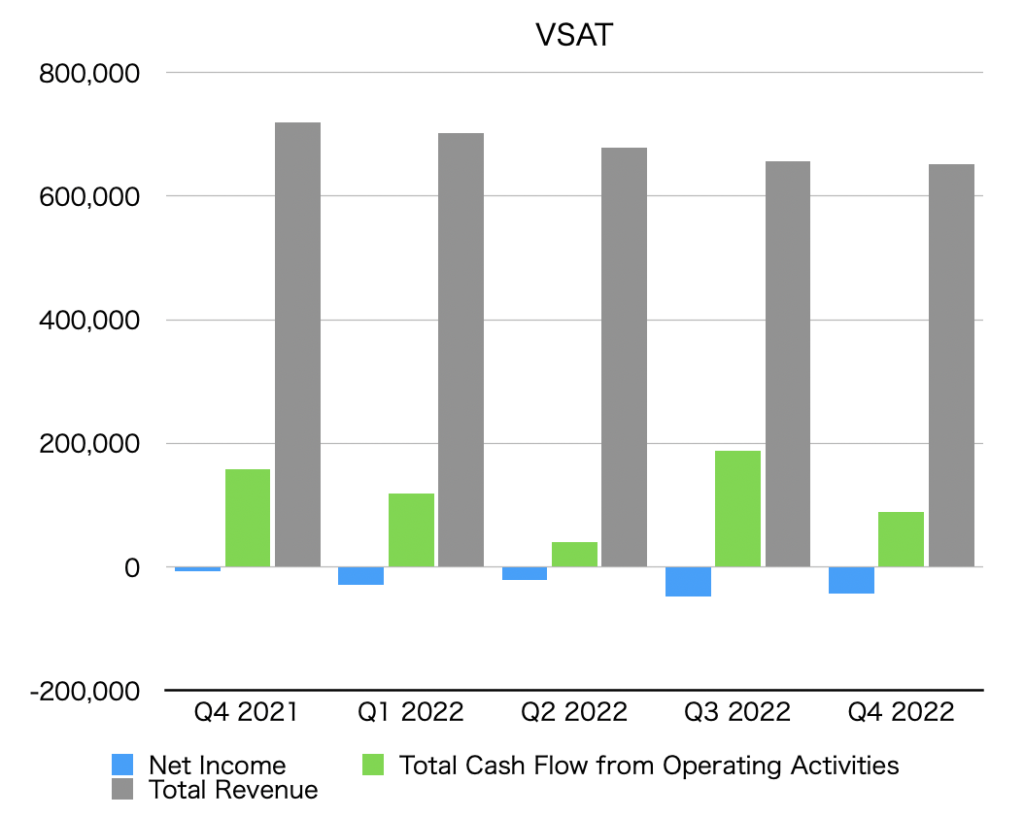
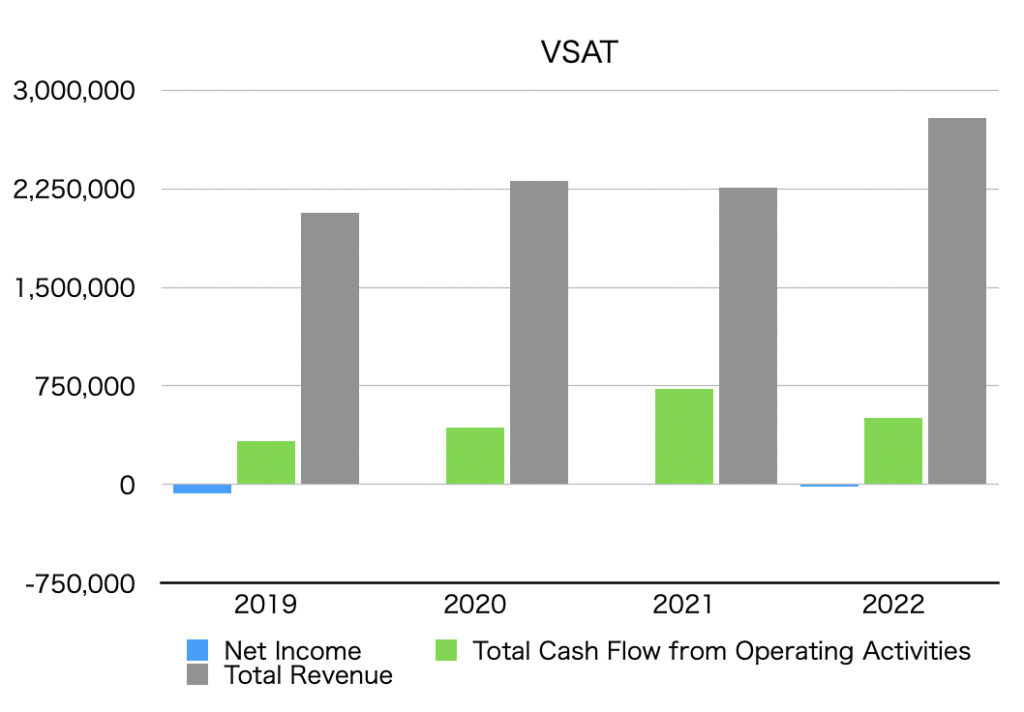
Summary of net income, operating cash flow, and total revenue (graph)
The unit is $1,000.
By quarter

By year
Net income
Net Income is below.
Quarterly data
| Net Income [$1,000] |
| Q4 2021 | -6,613 |
| Q1 2022 | -29,180 |
| Q2 2022 | -21,564 |
| Q3 2022 | -48,240 |
| Q4 2022 | -42,228 |
Annual data
| Net Income [$1,000] |
| 2019 | -67,623 |
| 2020 | -212 |
| 2021 | -3,691 |
| 2022 | -15,534 |
Operating cash flow
Total Cash Flow from Operating Activities is as follows.
Quarterly data
| Total Cash Flow from Operating Activities [$1,000] |
| Q4 2021 | 158,579 |
| Q1 2022 | 119,263 |
| Q2 2022 | 39,637 |
| Q3 2022 | 188,495 |
| Q4 2022 | 89,480 |
Annual data
| Total Cash Flow from Operating Activities [$1,000] |
| 2019 | 327,551 |
| 2020 | 436,936 |
| 2021 | 727,215 |
| 2022 | 505,641 |
Total revenue
Total revenue is below.
Quarterly data
| Total Revenue [$1,000] |
| Q4 2021 | 719,717 |
| Q1 2021 | 701,704 |
| Q2 2022 | 678,233 |
| Q3 2022 | 656,683 |
| Q4 2022 | 651,444 |
Annual data
| Total Revenue [$1,000] |
| 2019 | 2,068,258 |
| 2020 | 2,309,238 |
| 2021 | 2,256,107 |
| 2022 | 2,787,635 |
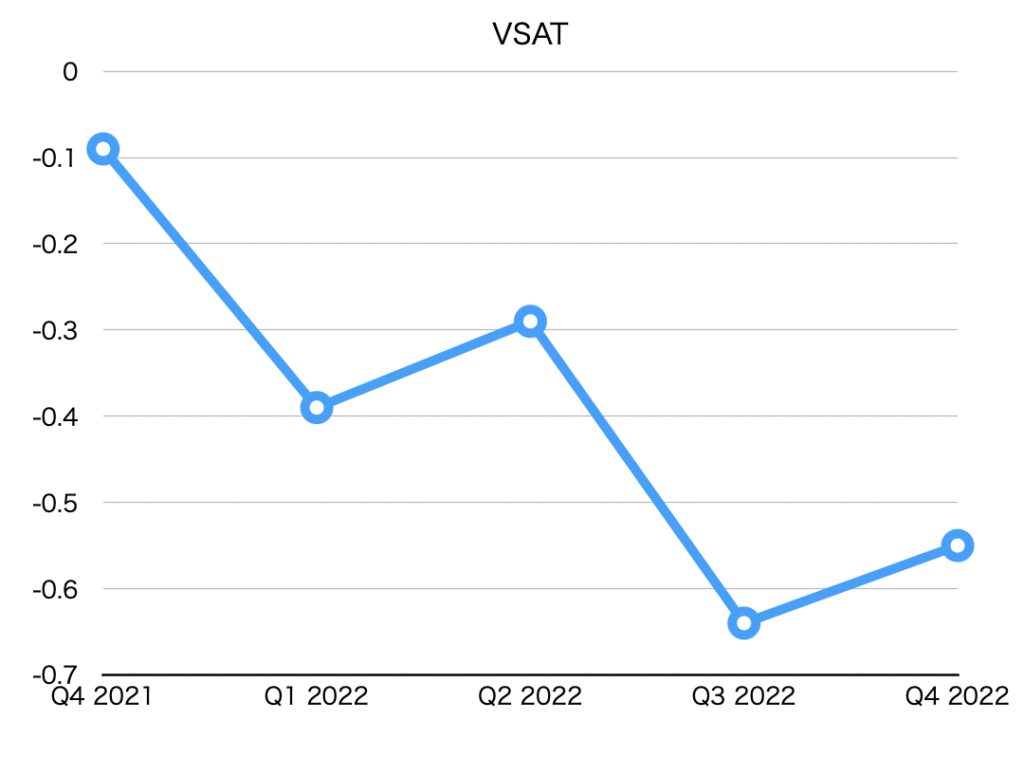
EPS (Net earnings per share)
| EPS [$] |
| Q4 2021 | -0.09 |
| Q1 2022 | -0.39 |
| Q2 2022 | -0.29 |
| Q3 2022 | -0.64 |
| Q4 2022 | -0.55 |
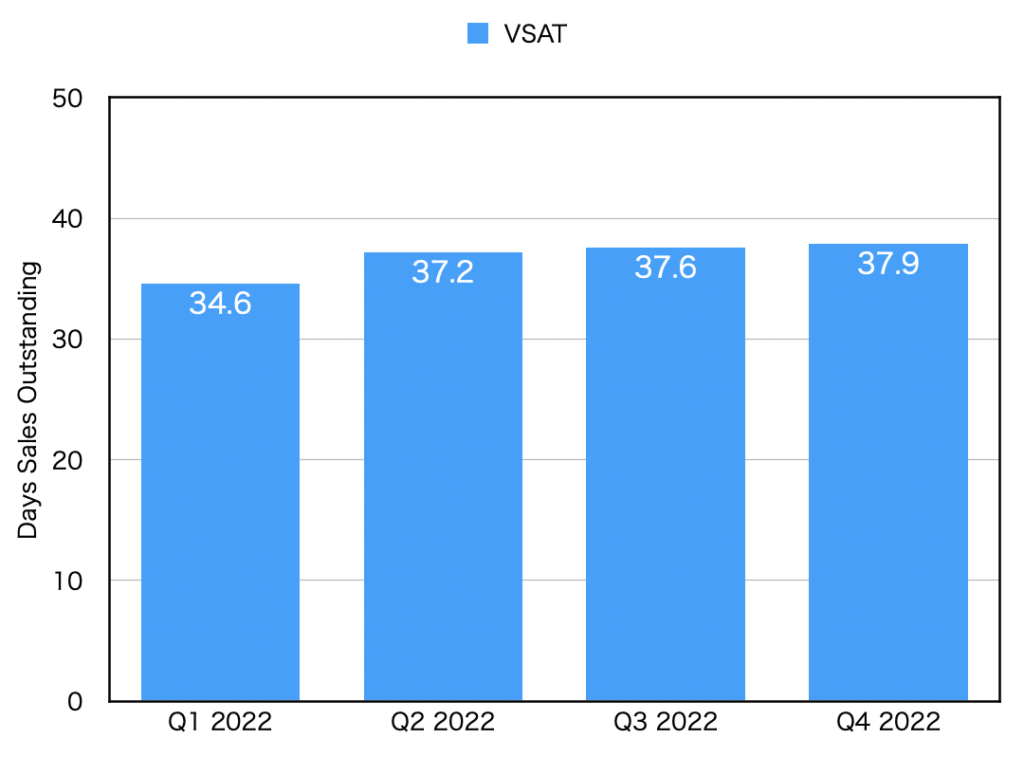
DSO(Days sales outstanding)
| DSO [day] |
| Q1 2022 | 34.6 |
| Q2 2022 | 37.2 |
| Q3 2022 | 37.6 |
| Q4 2022 | 37.9 |