TOC
Introduction
The financial results of ZoomInfo Technologies Inc is summarized in this page.
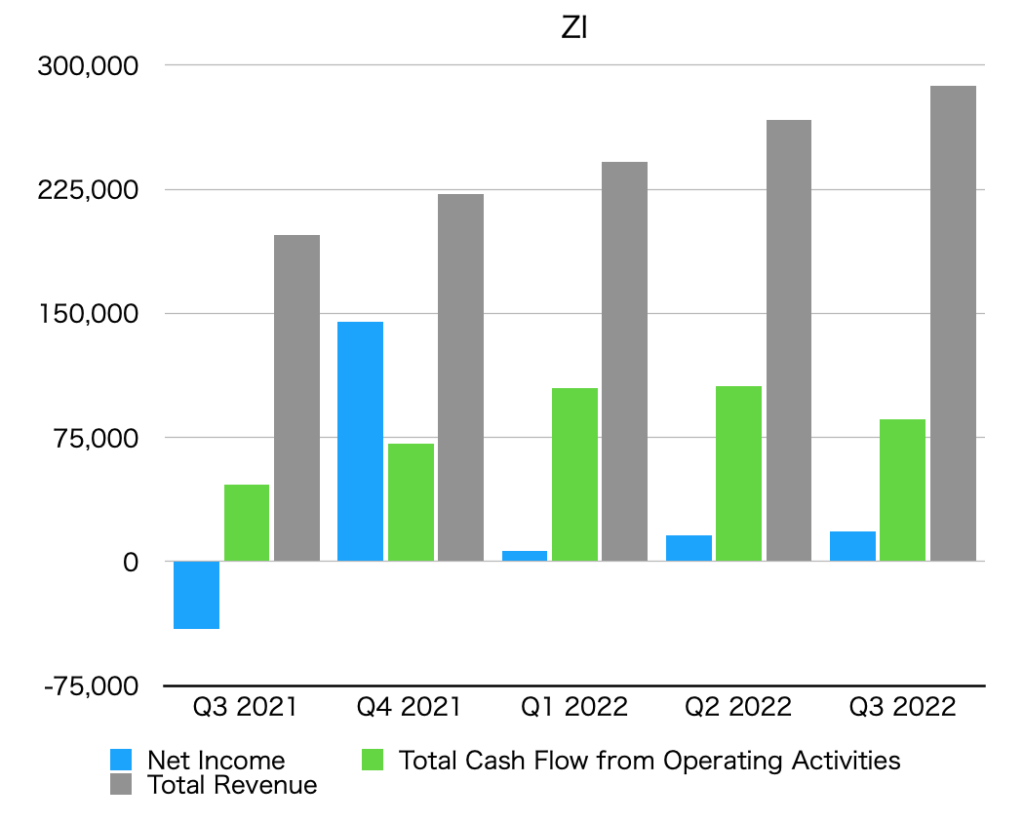
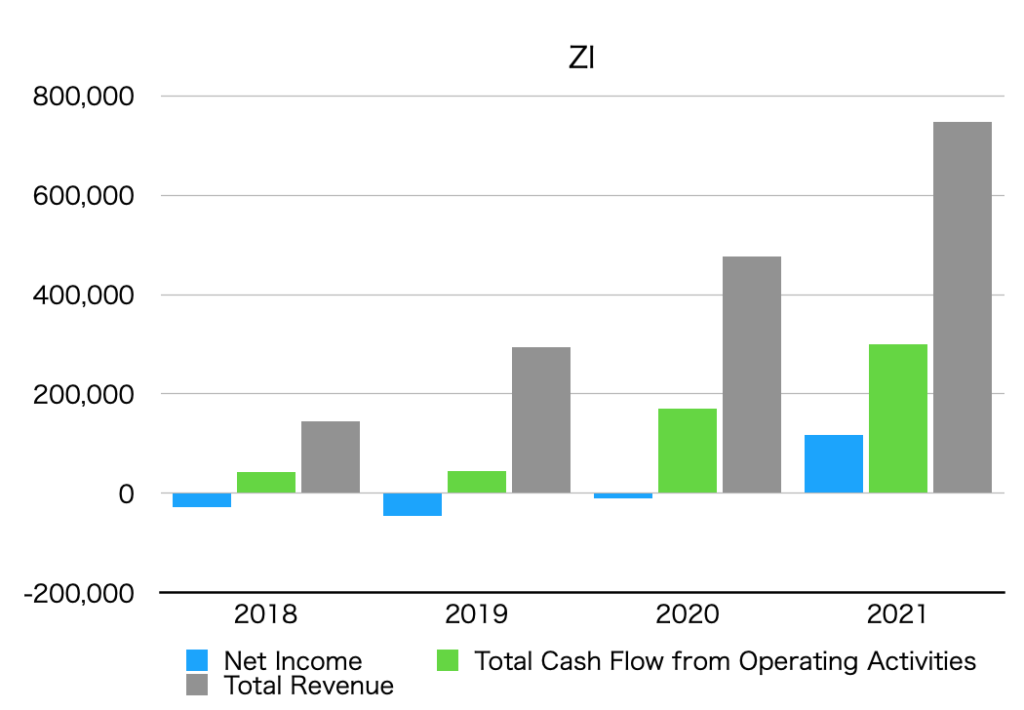
Summary of net income, operating cash flow, and total revenue (graph)
The unit is $1,000.
By quarter

By year

Net income
Net Income is below.
Quarterly data
| Net Income [$1,000] |
| Q3 2021 | -40,600 |
| Q4 2021 | 144,900 |
| Q1 2022 | 6,200 |
| Q2 2022 | 15,900 |
| Q3 2022 | 17,900 |
Annual data
| Net Income [$1,000] |
| 2018 | -28,600 |
| 2019 | -46,200 |
| 2020 | -9,100 |
| 2021 | 116,800 |
Operating cash flow
Total Cash Flow from Operating Activities is as follows.
Quarterly data
| Total Cash Flow from Operating Activities [$1,000] |
| Q3 2021 | 46,500 |
| Q4 2021 | 71,300 |
| Q1 2022 | 105,000 |
| Q2 2022 | 106,200 |
| Q3 2022 | 85,700 |
Annual data
| Total Cash Flow from Operating Activities [$1,000] |
| 2018 | 43,800 |
| 2019 | 44,400 |
| 2020 | 169,600 |
| 2021 | 299,400 |
Total revenue
Total revenue is below.
Quarterly data
| Total Revenue [$1,000] |
| Q3 2021 | 197,600 |
| Q4 2021 | 222,300 |
| Q1 2021 | 241,700 |
| Q2 2022 | 267,100 |
| Q3 2022 | 287,600 |
Annual data
| Total Revenue [$1,000] |
| 2018 | 144,300 |
| 2019 | 293,300 |
| 2020 | 476,200 |
| 2021 | 747,200 |
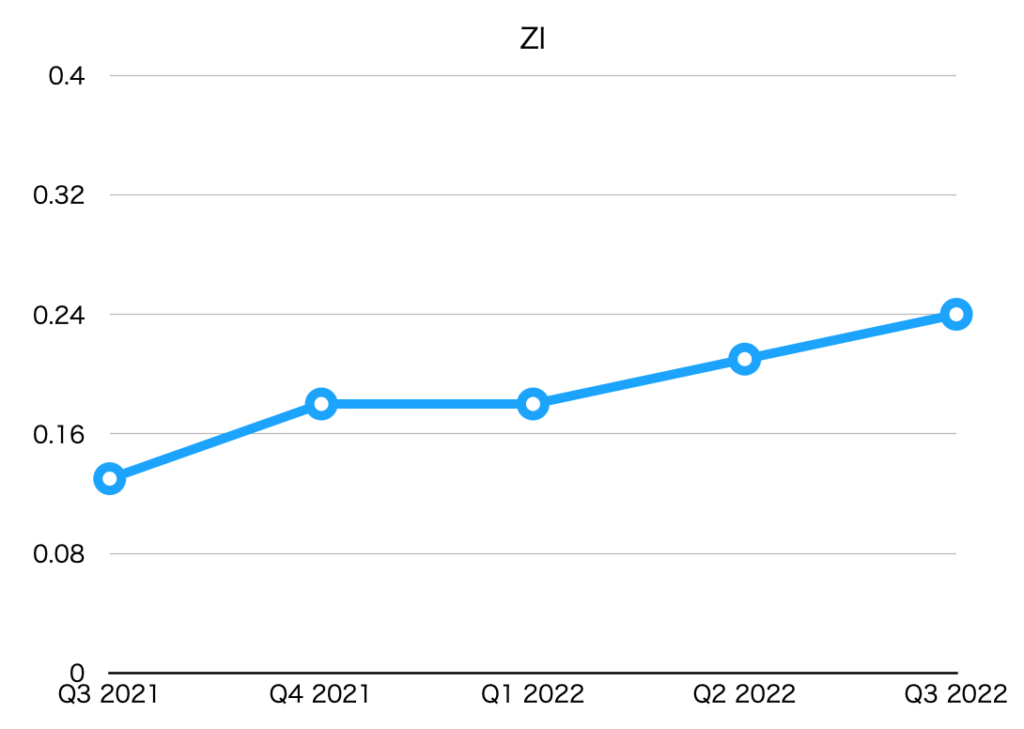
EPS (Net earnings per share)
| EPS [$] |
| Q3 2021 | 0.13 |
| Q4 2021 | 0.18 |
| Q1 2022 | 0.18 |
| Q2 2022 | 0.21 |
| Q3 2022 | 0.24 |

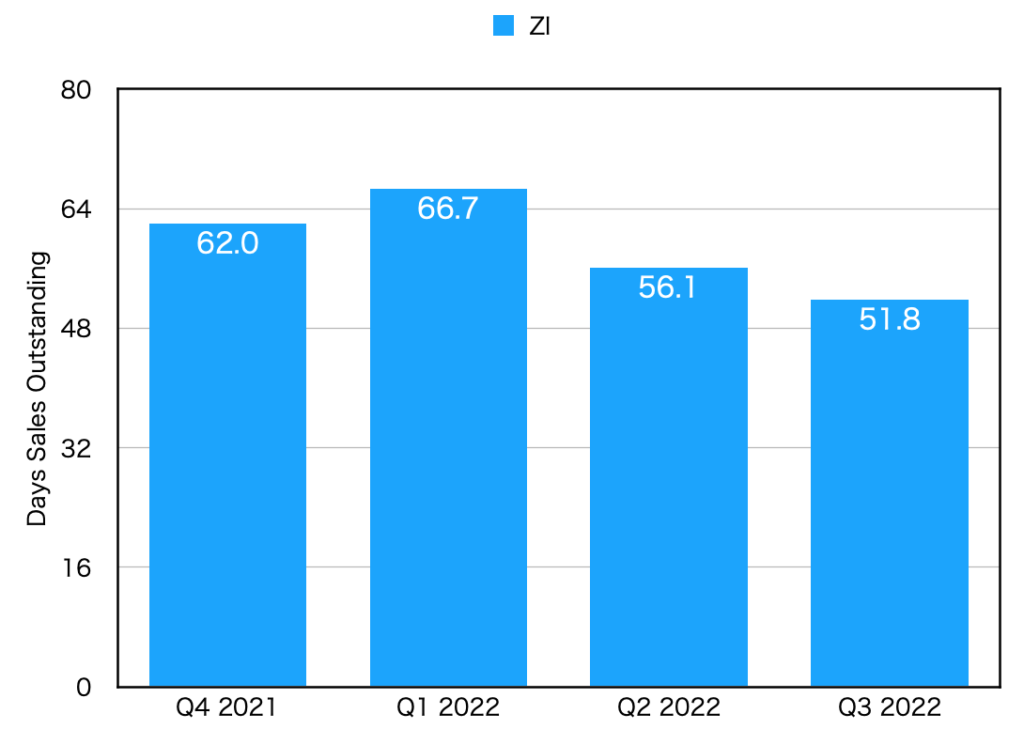
DSO(Days sales outstanding)
| DSO [day] |
| Q4 2021 | 62.0 |
| Q1 2022 | 66.7 |
| Q2 2022 | 56.1 |
| Q3 2022 | 51.8 |


