TOC
Introduction
The financial results of CrowdStrike Holdings, Inc. is summarized in this page.
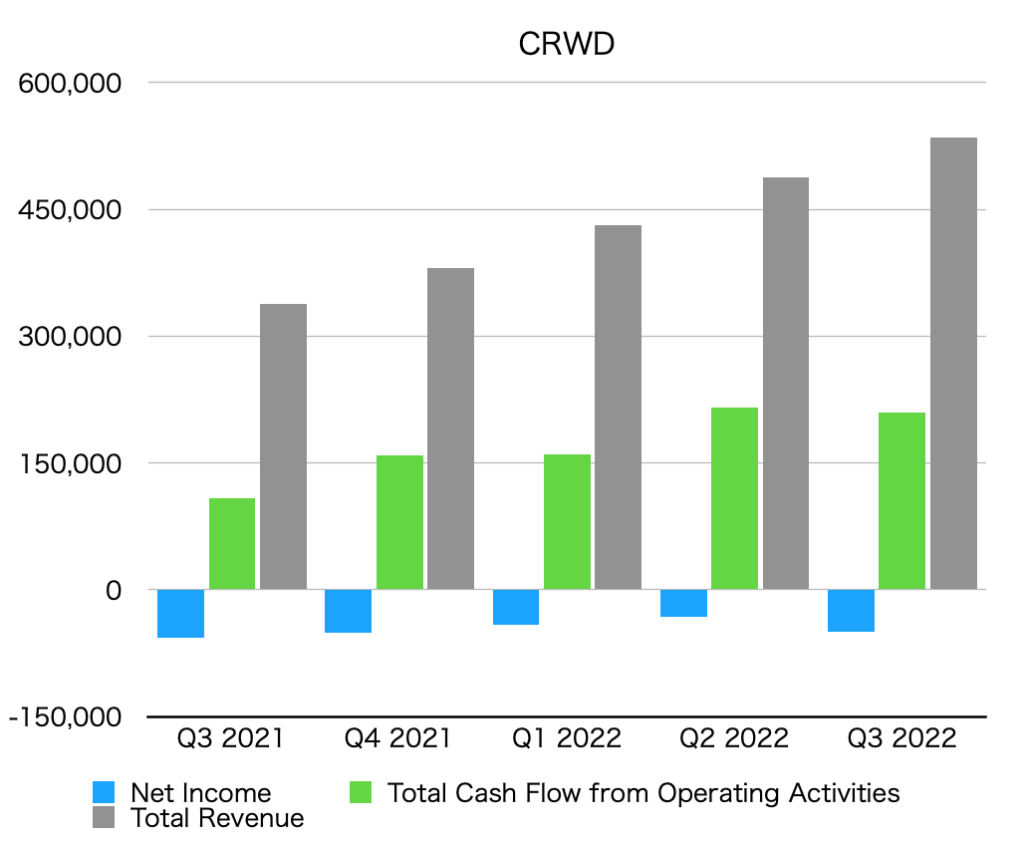
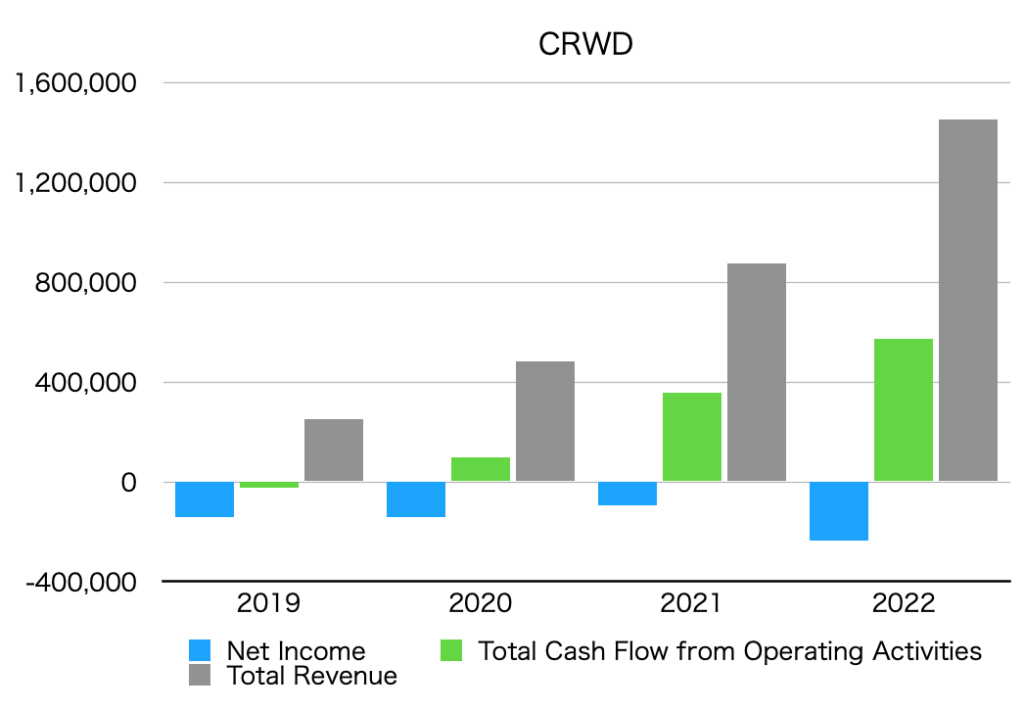
Summary of net income, operating cash flow, and total revenue (graph)
The unit is $1,000.
By quarter

By year

Net income
Net Income is below.
Quarterly data
| Net Income [$1,000] |
| Q3 2021 | -57,318 |
| Q4 2021 | -50,455 |
| Q1 2022 | -41,980 |
| Q2 2022 | -31,523 |
| Q3 2022 | -49,285 |
Annual data
| Net Income [$1,000] |
| 2019 | -140,077 |
| 2020 | -141,779 |
| 2021 | -92,629 |
| 2022 | -234,802 |
Operating cash flow
Total Cash Flow from Operating Activities is as follows.
Quarterly data
| Total Cash Flow from Operating Activities [$1,000] |
| Q3 2021 | 108,475 |
| Q4 2021 | 159,058 |
| Q1 2022 | 159,718 |
| Q2 2022 | 214,957 |
| Q3 2022 | 209,906 |
Annual data
| Total Cash Flow from Operating Activities [$1,000] |
| 2019 | -22,968 |
| 2020 | 99,943 |
| 2021 | 356,566 |
| 2022 | 574,784 |
Total revenue
Total revenue is below.
Quarterly data
| Total Revenue [$1,000] |
| Q3 2021 | 337,690 |
| Q4 2021 | 380,051 |
| Q1 2022 | 431,010 |
| Q2 2022 | 487,834 |
| Q3 2022 | 535,153 |
Annual data
| Total Revenue [$1,000] |
| 2019 | 249,824 |
| 2020 | 481,413 |
| 2021 | 874,438 |
| 2022 | 1,451,594 |
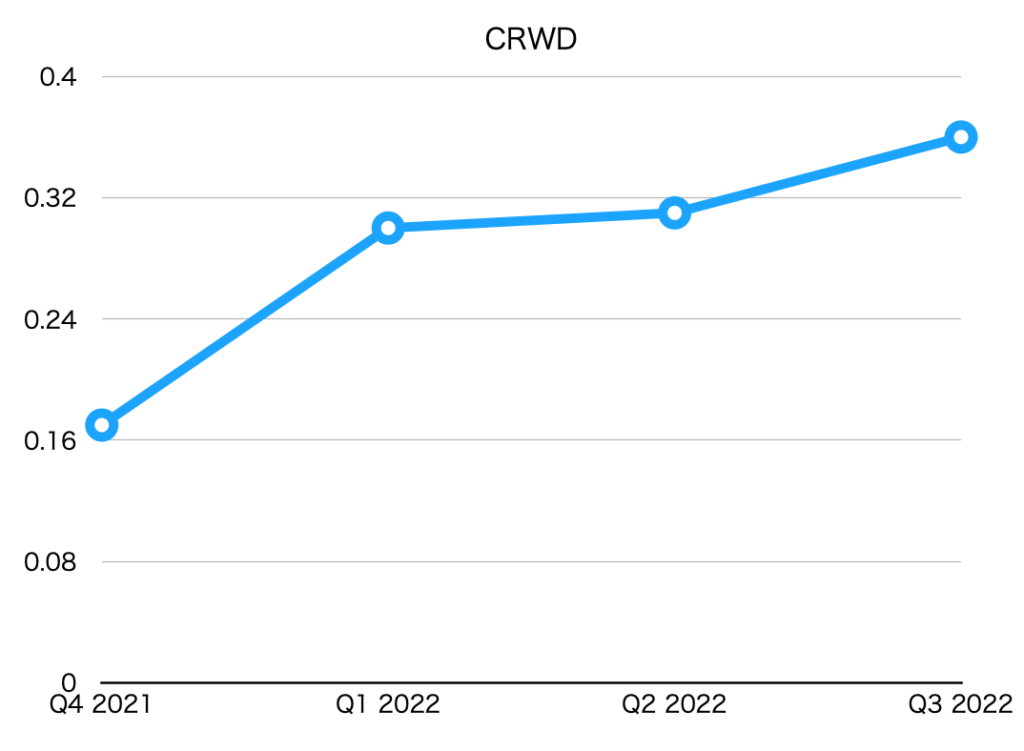
EPS (Net earnings per share)
| EPS [$] |
| Q4 2021 | 0.17 |
| Q1 2022 | 0.30 |
| Q2 2022 | 0.31 |
| Q3 2022 | 0.36 |

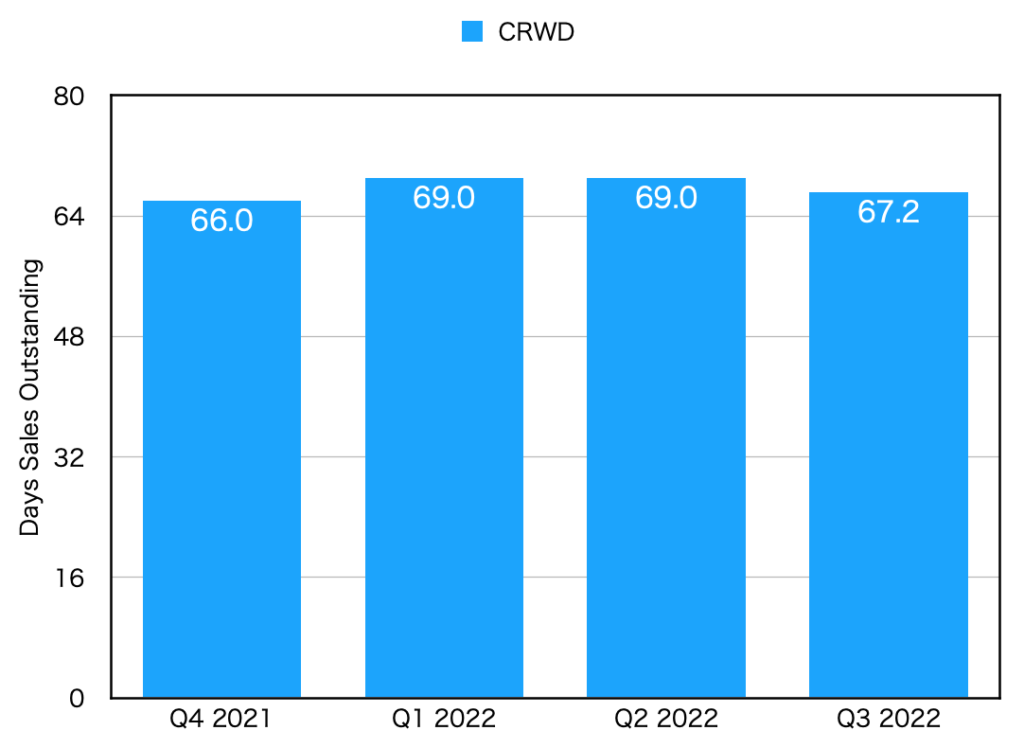
DSO(Days sales outstanding)
| DSO [day] |
| Q4 2021 | 66.0 |
| Q1 2022 | 69.0 |
| Q2 2022 | 69.0 |
| Q3 2022 | 67.2 |

